Open Access
Fig. C.4
Download original image
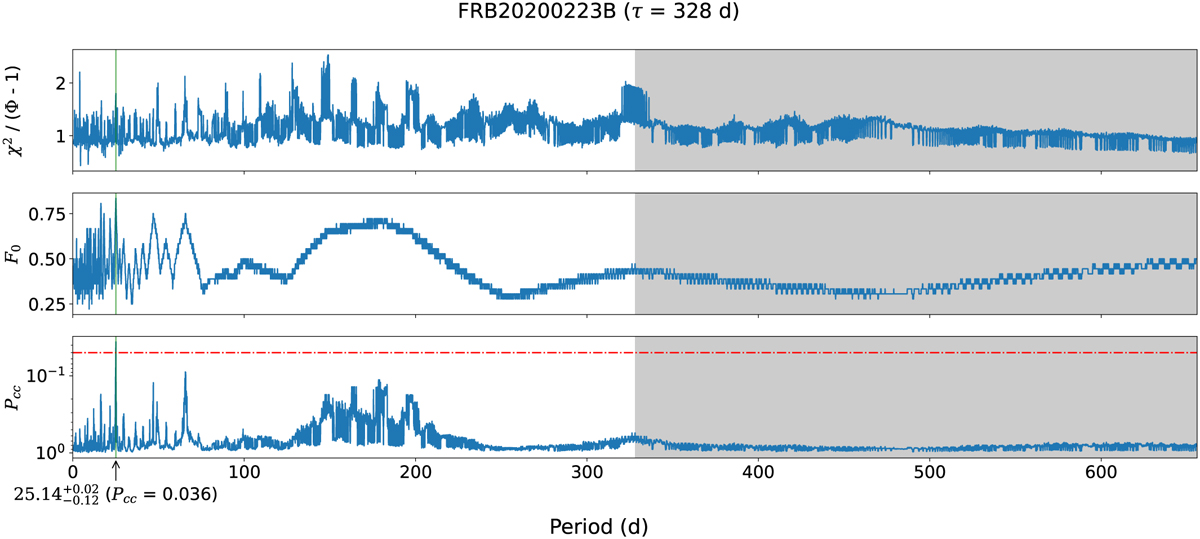
Individual periodograms for χ2 and F0 metric stacked on top of each other and Pcc for FRB 20200223B. The y-axis of Pcc is inverted to match the peak pattern of both metrics. The text clarifies the meaning of the colours.
Current usage metrics show cumulative count of Article Views (full-text article views including HTML views, PDF and ePub downloads, according to the available data) and Abstracts Views on Vision4Press platform.
Data correspond to usage on the plateform after 2015. The current usage metrics is available 48-96 hours after online publication and is updated daily on week days.
Initial download of the metrics may take a while.