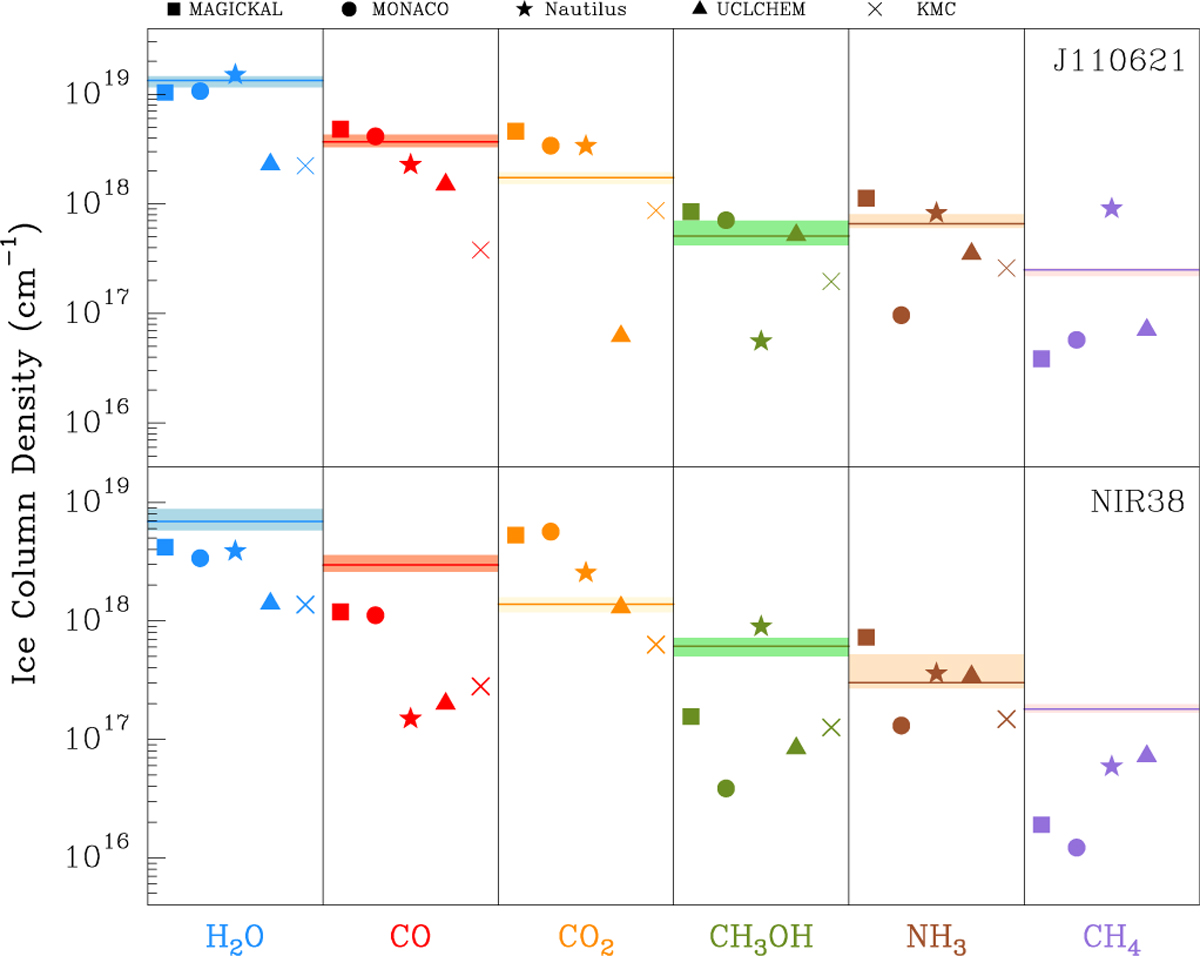
Fig. 5
Download original image
Comparison between the ice column densities predicted by all codes for the best-fit models, and with the Ice Age observed values. The different colours indicate different molecular species and the different symbols label the distinct astrochemical codes used in this work (see legend at top of figure). The horizontal lines show the observed ice column densities reported in Table 4 and the shaded areas indicate their associated errors.
Current usage metrics show cumulative count of Article Views (full-text article views including HTML views, PDF and ePub downloads, according to the available data) and Abstracts Views on Vision4Press platform.
Data correspond to usage on the plateform after 2015. The current usage metrics is available 48-96 hours after online publication and is updated daily on week days.
Initial download of the metrics may take a while.