Fig. D.1
Download original image
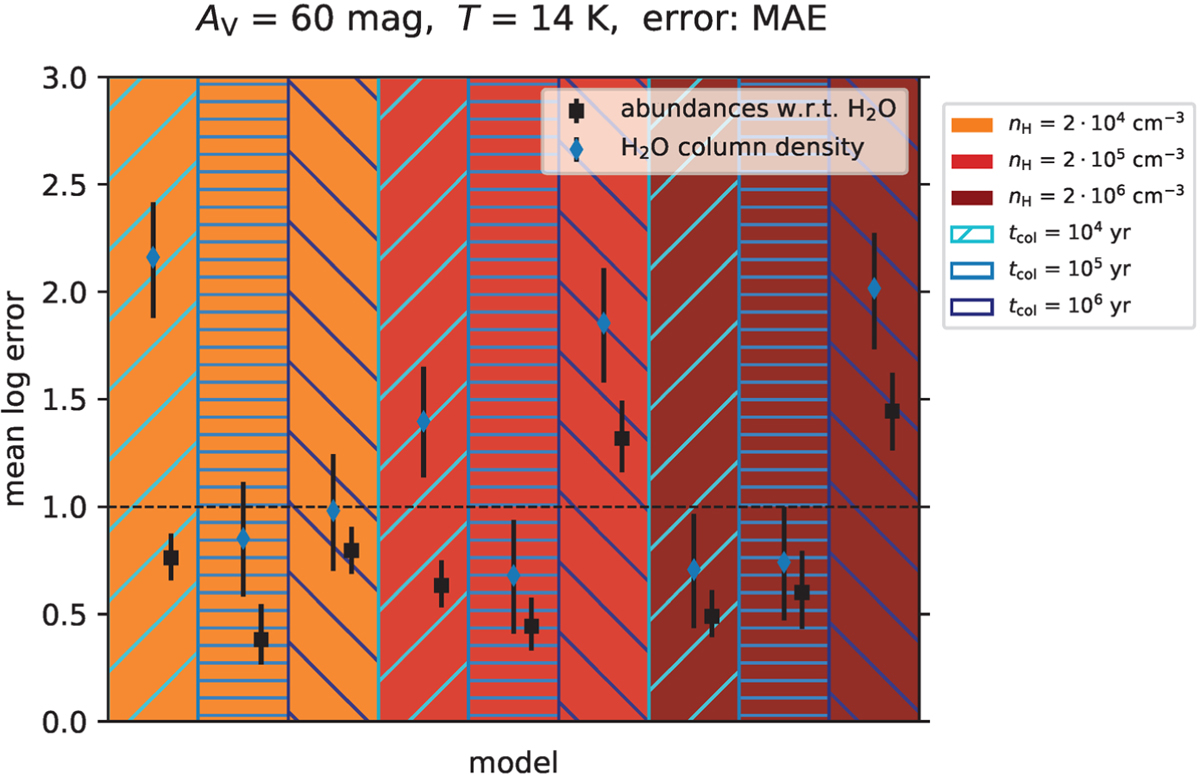
Logarithmic errors between the predicted ice compositions by the different models of UCLCHEM for AV = 60 mag with Tdust = 14 K. Errors for only the H2O column densities are indicated with blue rhombus, while black squares mark the errors calculated with the abundances with respect to water, both superimposed to the bars that represent the models in previous figures. Error bars correspond to 3σ.
Current usage metrics show cumulative count of Article Views (full-text article views including HTML views, PDF and ePub downloads, according to the available data) and Abstracts Views on Vision4Press platform.
Data correspond to usage on the plateform after 2015. The current usage metrics is available 48-96 hours after online publication and is updated daily on week days.
Initial download of the metrics may take a while.