Fig. 4
Download original image
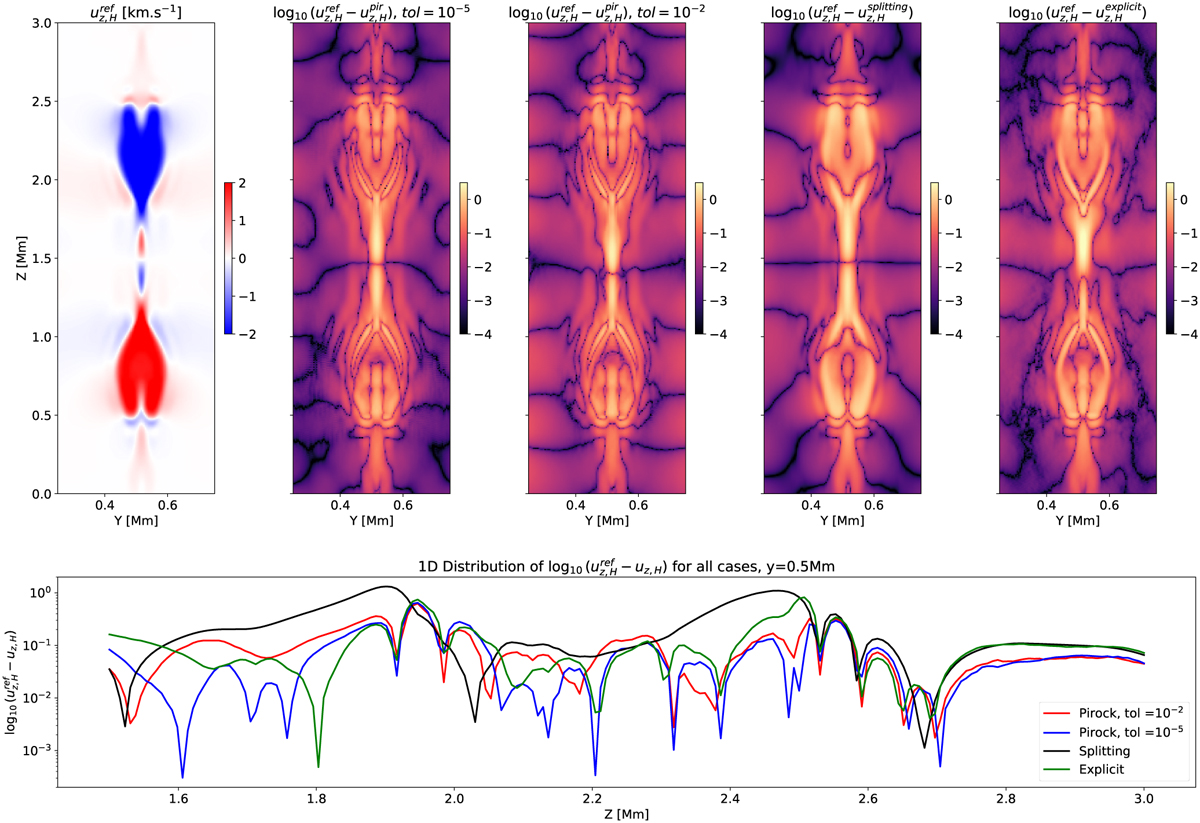
Top, far left: distribution of the reference solution of the velocity uz,H in a restricted domain along the y direction (y ∈ [0.2, 0.8] Mm) in km s−1. Top, center and right: two-dimensional figures representing represent the logarithm of the difference between the reference and the numerical solution ![]() for PIROCK with tolerance 10−5, 10−2, splitting, and explicit. Bottom: one-dimensional distribution
for PIROCK with tolerance 10−5, 10−2, splitting, and explicit. Bottom: one-dimensional distribution ![]() of all these cases at y = 0.5 Mm and z ∈ [1.5, 3] Mm at t = 50 s.
of all these cases at y = 0.5 Mm and z ∈ [1.5, 3] Mm at t = 50 s.
Current usage metrics show cumulative count of Article Views (full-text article views including HTML views, PDF and ePub downloads, according to the available data) and Abstracts Views on Vision4Press platform.
Data correspond to usage on the plateform after 2015. The current usage metrics is available 48-96 hours after online publication and is updated daily on week days.
Initial download of the metrics may take a while.