Fig. 3
Download original image
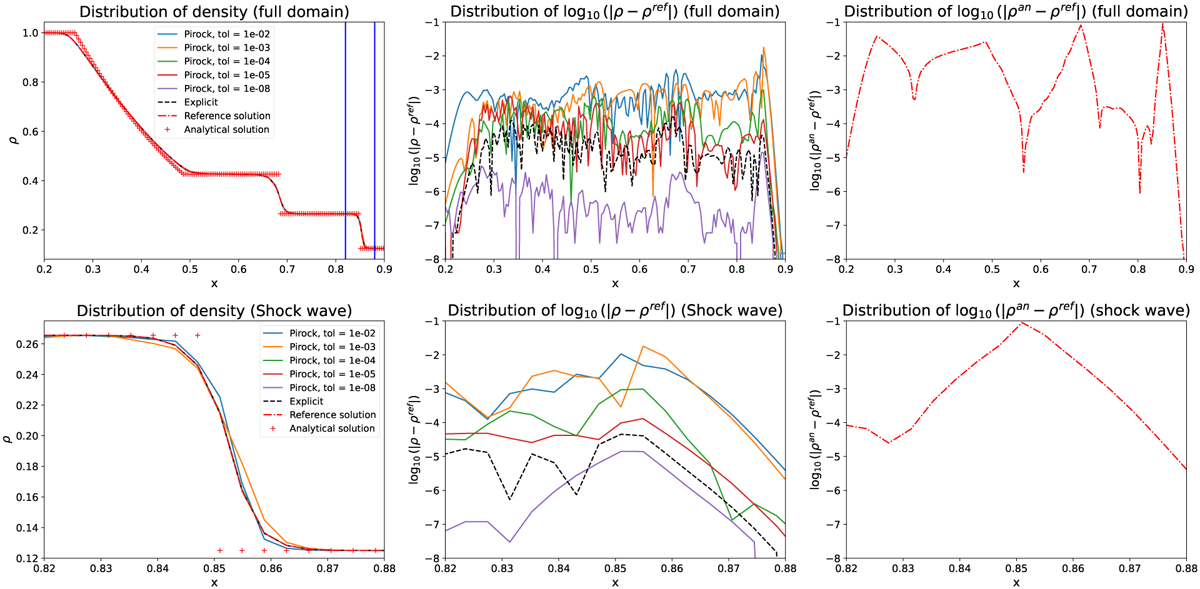
Density distribution across the entire domain for PIROCK with different tolerances, the explicit approach, and reference solutions (top left). The top-middle panel depicts the distribution of the logarithm of the absolute difference, log10(|ρ − ρref|), between the different scenarios and the reference solution. The top-right panel shows the distribution of the logarithm of the absolute difference between analytical and reference solution log10(|ρ − ρref|). The bottom panels mirror the top ones but focus specifically on the shock region between x=0.82 and 0.88 (indicated by the two vertical blue lines in the top-left panel). The red dashed line represents the reference solution, and the black dashed line corresponds to the explicit. The remaining colors represent different PIROCK cases with varying tolerances.
Current usage metrics show cumulative count of Article Views (full-text article views including HTML views, PDF and ePub downloads, according to the available data) and Abstracts Views on Vision4Press platform.
Data correspond to usage on the plateform after 2015. The current usage metrics is available 48-96 hours after online publication and is updated daily on week days.
Initial download of the metrics may take a while.