Fig. 7
Download original image
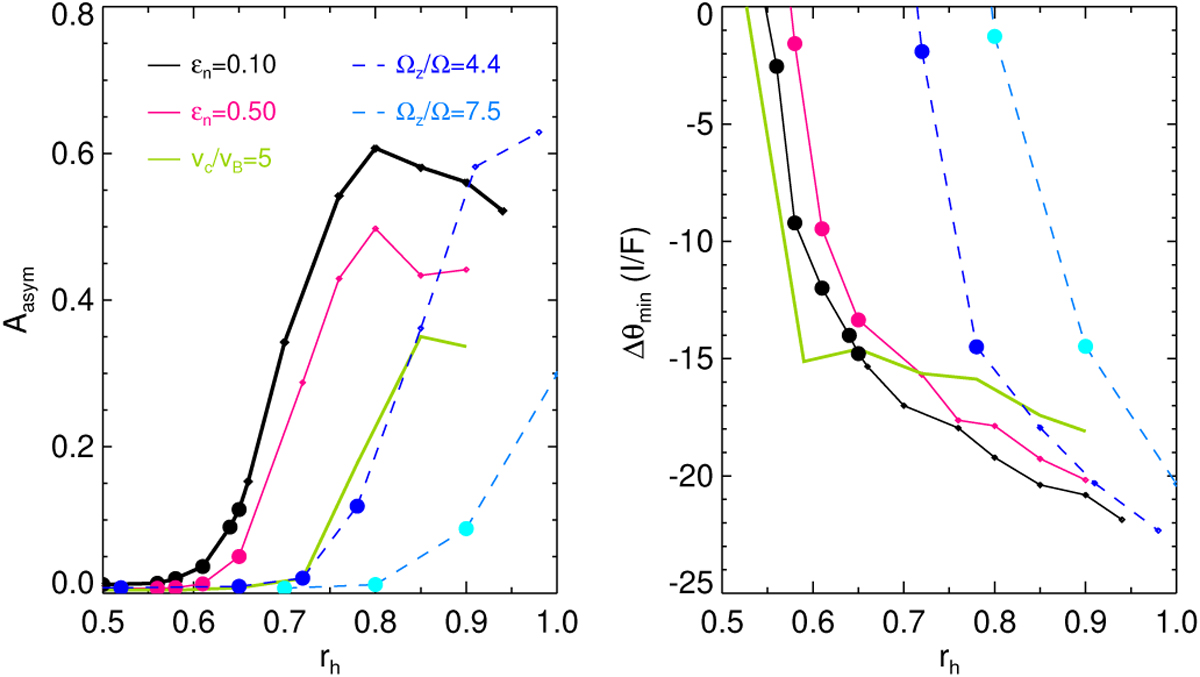
Photometric quantities extracted from τdyn = 1 simulations, using different elasticity laws, ϵn = 0.1, 0.5, and Bridges-formula with vc /vB = 5. Additionally, dashed line indicates results from simulations with a ‘hybrid’-method, with Ωz/Ω = 4.4 and 7.5, both using ϵn = 0.1. Filled circles denote runs developing overstability.
Current usage metrics show cumulative count of Article Views (full-text article views including HTML views, PDF and ePub downloads, according to the available data) and Abstracts Views on Vision4Press platform.
Data correspond to usage on the plateform after 2015. The current usage metrics is available 48-96 hours after online publication and is updated daily on week days.
Initial download of the metrics may take a while.