Open Access
Fig. 6
Download original image
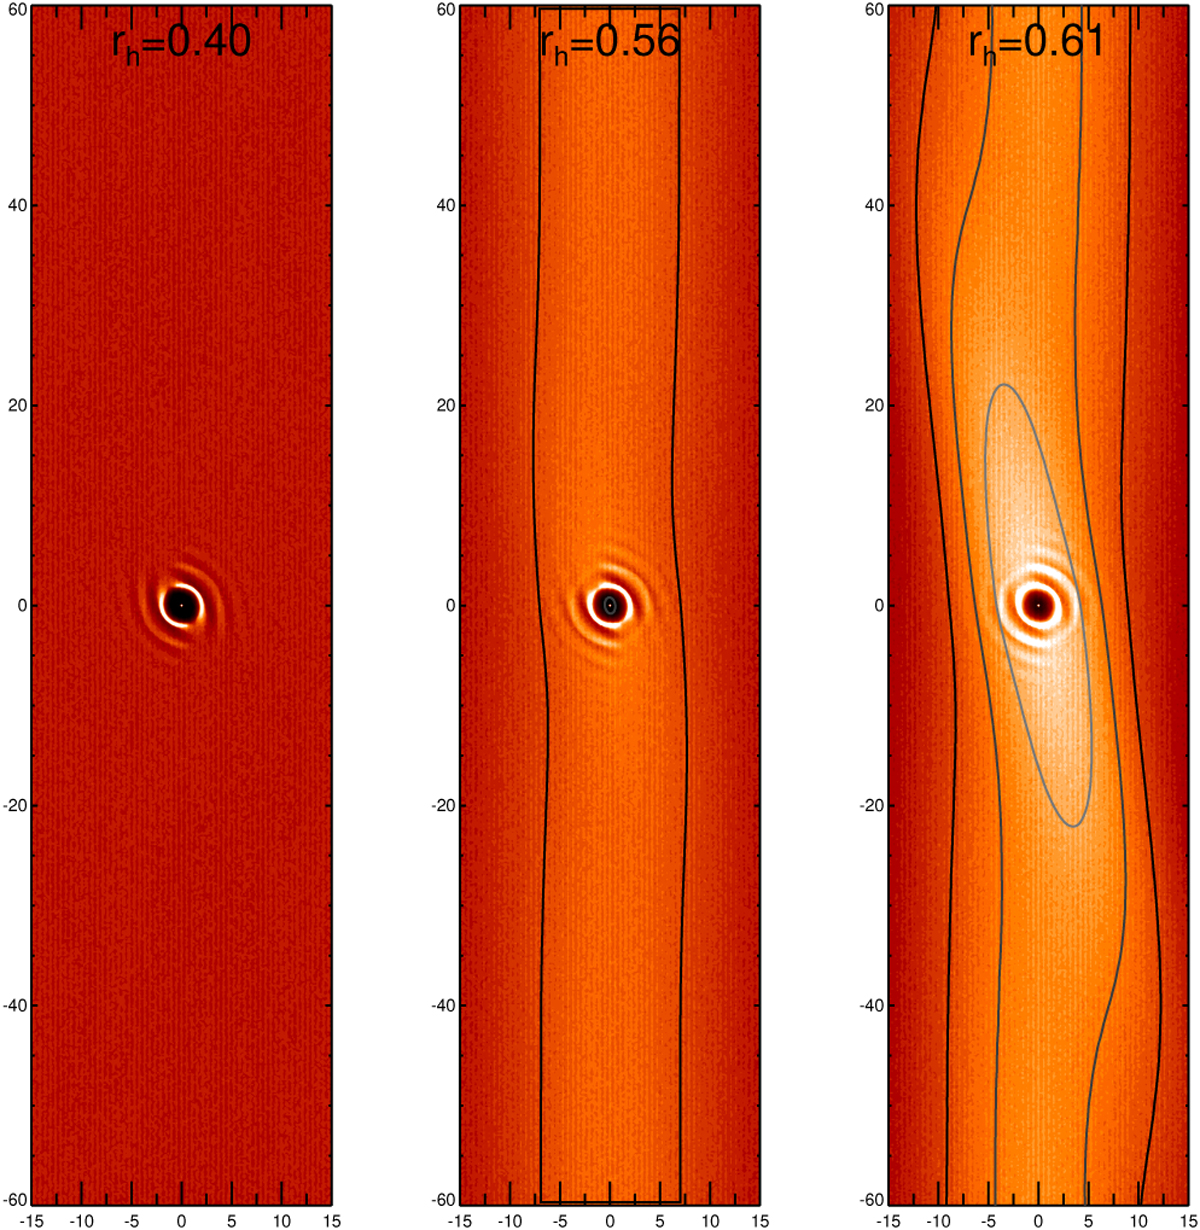
Density autocorrelation functions for rh = 0.40, 0.56, and 0.61. The central 30 × 120 particle radii regions are shown, while λcr/R = 9.7, 29.4, and 34.2, respectively. Contours mark overdensities of 1.1, 1.2, and 1.3; for clarity contours are not shown for the central region. In all runs τdyn = 1.0 and ϵn = 0.1.
Current usage metrics show cumulative count of Article Views (full-text article views including HTML views, PDF and ePub downloads, according to the available data) and Abstracts Views on Vision4Press platform.
Data correspond to usage on the plateform after 2015. The current usage metrics is available 48-96 hours after online publication and is updated daily on week days.
Initial download of the metrics may take a while.