Fig. 5
Download original image
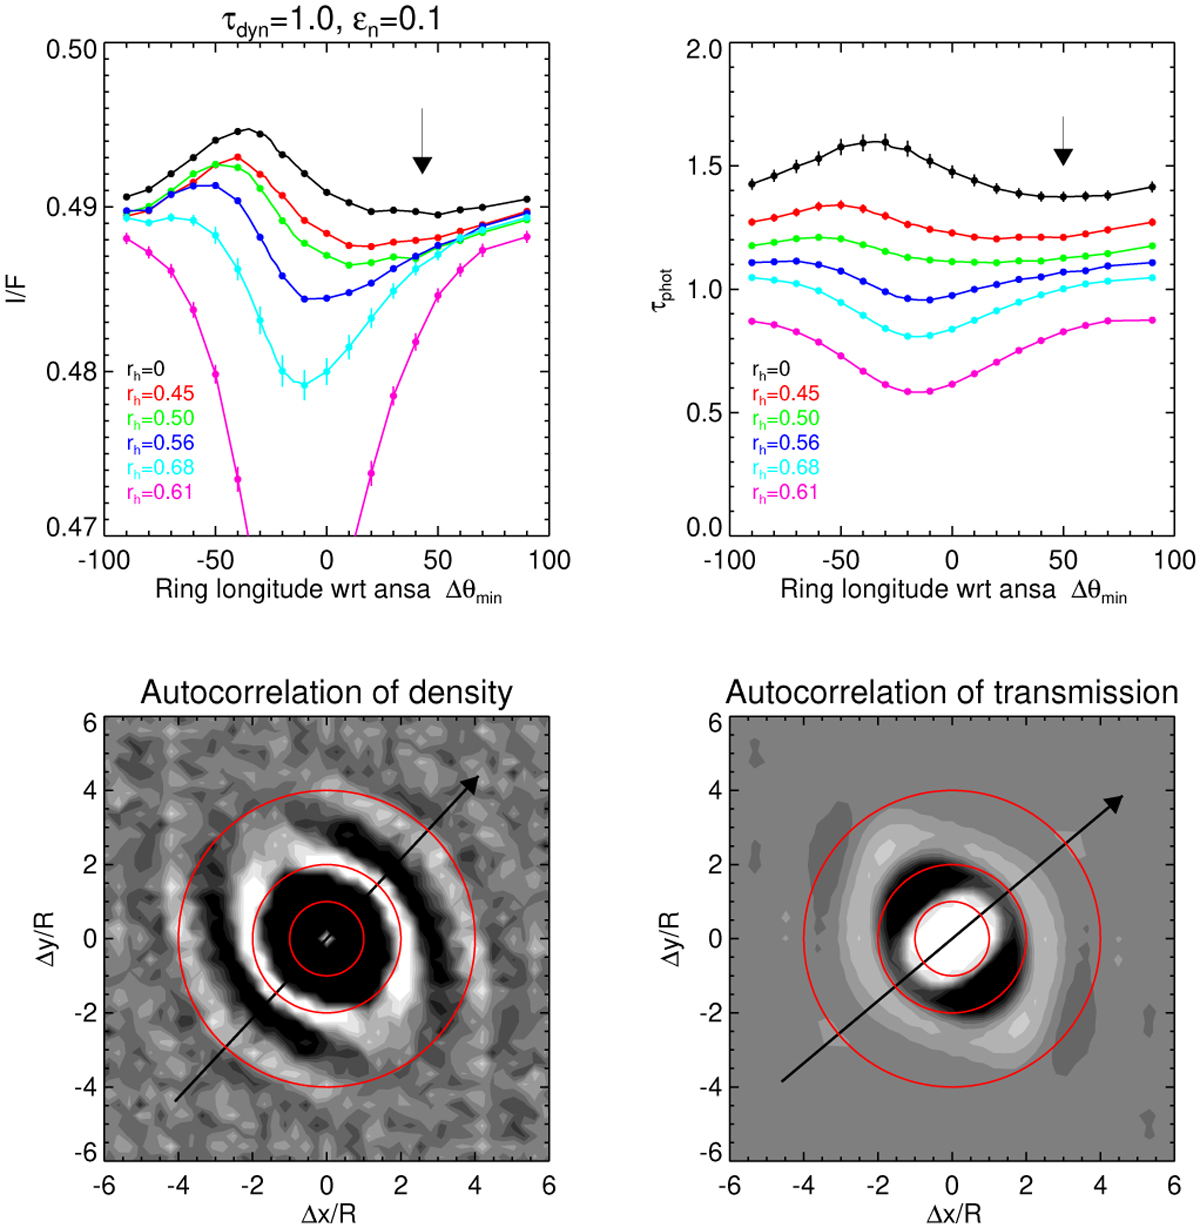
‘Anomalous’ asymmetry at weakly gravitating systems. Upper row: I/F and τphot profiles in simulations with rh = 0–0.61. Error bars indicate the error of the mean, calculated from the RMS values over 20 snapshots. Arrows mark the location of the minimum I/F and τphot in non-gravitating rh = 0 run. Lower row: autocorrelation functions of density and transmission for rh = 0. Only the central parts are show: circles correspond to 1, 2, 4 particle radii. The density autocorrelation was constructed from number density of particle centres. The transmission autocorrelation was calculated from a binary table constructed by illuminating the particle field vertically with 25 ⋅ 106 photons, and assigning values 0 and 1 for locations where photons were intersected/not intersected by any particle, respectively (resolution of the grid was 0.3 particle radii). In both cases a normalised autocorrelation is displayed, the grey scale extending from 0.9 (black) to 1.1 (white). Arrows indicate the viewing directions corresponding to the minimum of I/F and τphot.
Current usage metrics show cumulative count of Article Views (full-text article views including HTML views, PDF and ePub downloads, according to the available data) and Abstracts Views on Vision4Press platform.
Data correspond to usage on the plateform after 2015. The current usage metrics is available 48-96 hours after online publication and is updated daily on week days.
Initial download of the metrics may take a while.