Fig. 4
Download original image
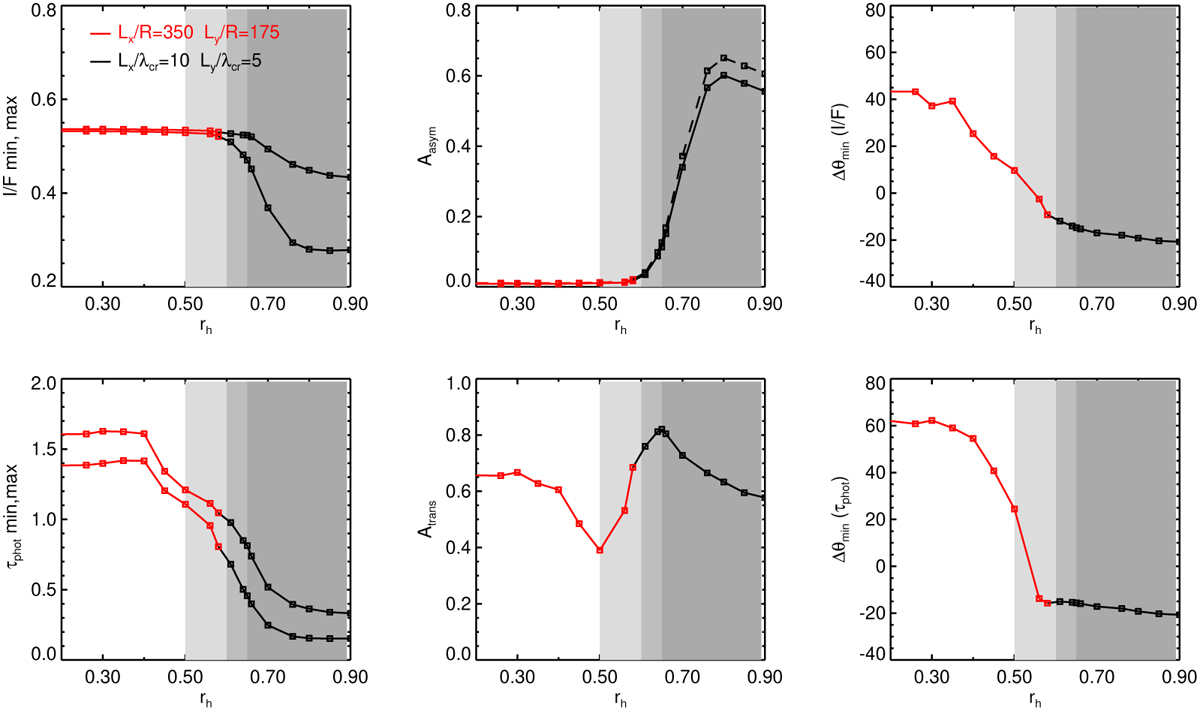
Photometric quantities extracted from τdyn = 1, ϵn = 0.1 simulations, performed for various values of rh. The simulations marked with black symbols, for rh ≥ 0.61 are the same simulations as displayed in Fig. 7 of Mondino-Llermanos & Salo (2023), with the calculation size of 5λcr × 10λcr. The red symbols indicate simulations with rh < 0.61: to have a better statistics in photometric calculations, the simulated region does not scale with λcr but has a fixed size of 350 × 175 particle radii (this corresponds to 5λcr × 10λcr at rh = 0.61). The upper row shows quantities related to the azimuthal I/F profiles: the minimum and maximum brightness, the amplitude Aasym defined in Eq. (19) and ∆θmin, the longitude of I/F minima wrt to ansae. In the case of self-gravity wakes, their pitch angle ϕw = −∆θmin. In the middle upper panel, the dashed curve corresponds to Lambert-phase function with ϖ = 0.7; in other cases Callisto phase function with ϖ = 0.4 is assumed. The lower row displays similar quantities derived from the optical depth profiles. Light shading (rh = 0.5–0.6) indicates the regime where overstability emerges and grows in amplitude, while the dark shading marks the regime where wakes suppress overstability (rh > 0.65).
Current usage metrics show cumulative count of Article Views (full-text article views including HTML views, PDF and ePub downloads, according to the available data) and Abstracts Views on Vision4Press platform.
Data correspond to usage on the plateform after 2015. The current usage metrics is available 48-96 hours after online publication and is updated daily on week days.
Initial download of the metrics may take a while.