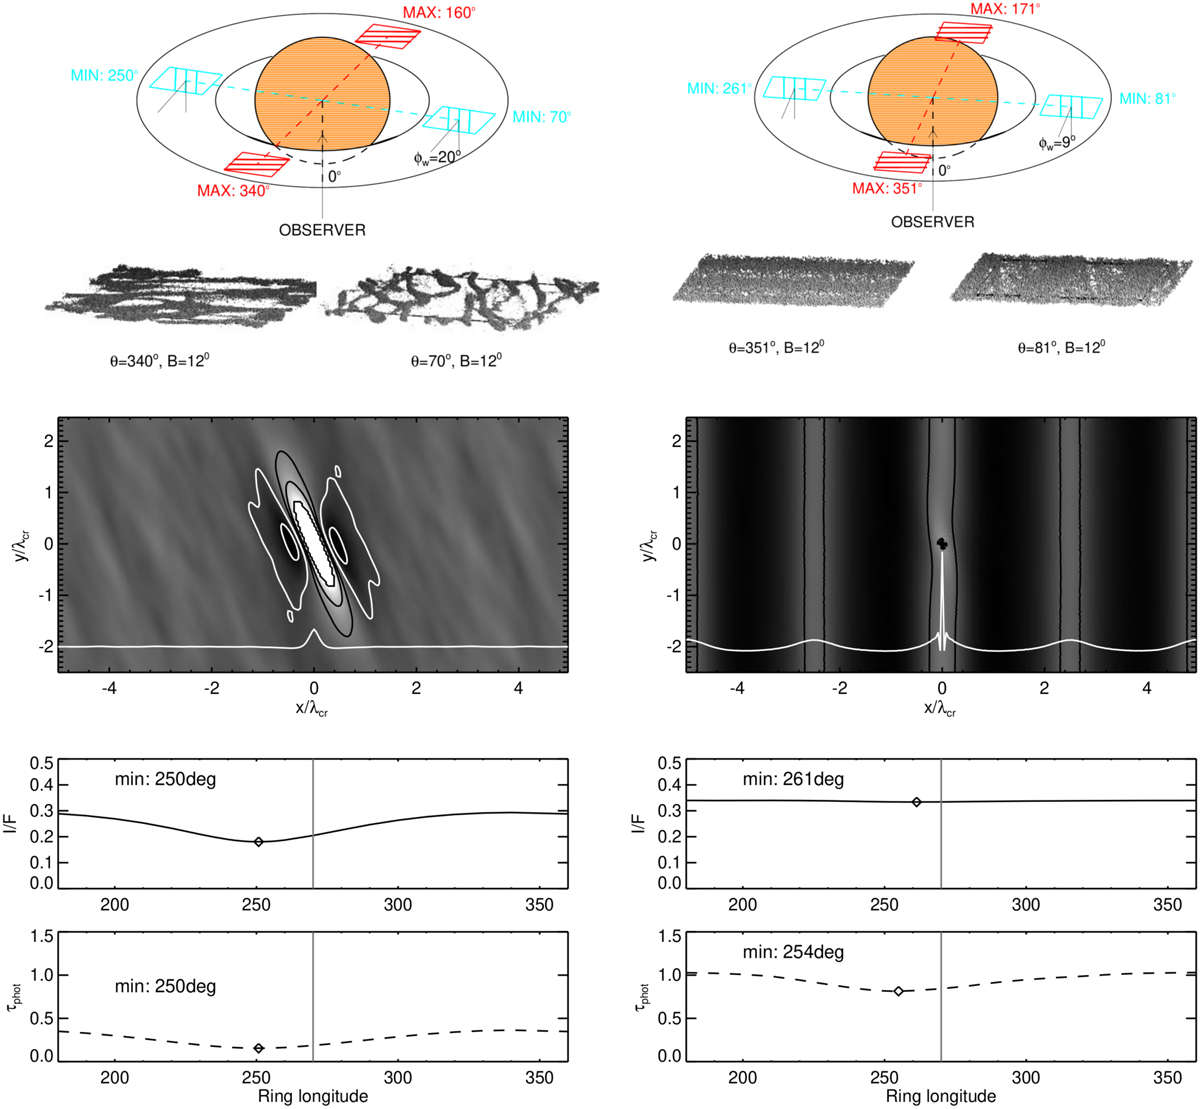
Fig. 3
Download original image
Illustration of two simulations, representing strong (rh = 0.80; left) and intermediate strength of self-gravity (rh = 0.58; right). The former case leads to prominent wake structure, the latter to overstable oscillations with weak embedded wakes. The cartoon in the uppermost row illustrates how such systems would appear at different ring longitudes, when viewed from B = 12° elevation. Orbital motion is counter-clockwise in the figure. The next row shows the normalised density autocorrelation function from these experiments: in the left the shading, from white to black corresponds to 0.5 to 1.5 (contours mark 0.8, 0.9, 1.1, 1.4), while in the right the range 0.75 to 1.25 is shown (contours 0.8, 0.95, 1.1, 1.2). The white curve near the bottom of the frames is a radial cut of the autocorrelation at ∆y = 0. The last two rows display the modelled I/F and τphot versus ring longitude, for B = B′ = 12° and ∆λ⊙ = 0°. Symbols mark the minimum of modelled I/F and τphot. Both the autocorrelation plots and the photometric curves are averages over 40 snapshots; for each snapshot 105 photons were followed for 36 ring longitudes separated by 10°.
Current usage metrics show cumulative count of Article Views (full-text article views including HTML views, PDF and ePub downloads, according to the available data) and Abstracts Views on Vision4Press platform.
Data correspond to usage on the plateform after 2015. The current usage metrics is available 48-96 hours after online publication and is updated daily on week days.
Initial download of the metrics may take a while.