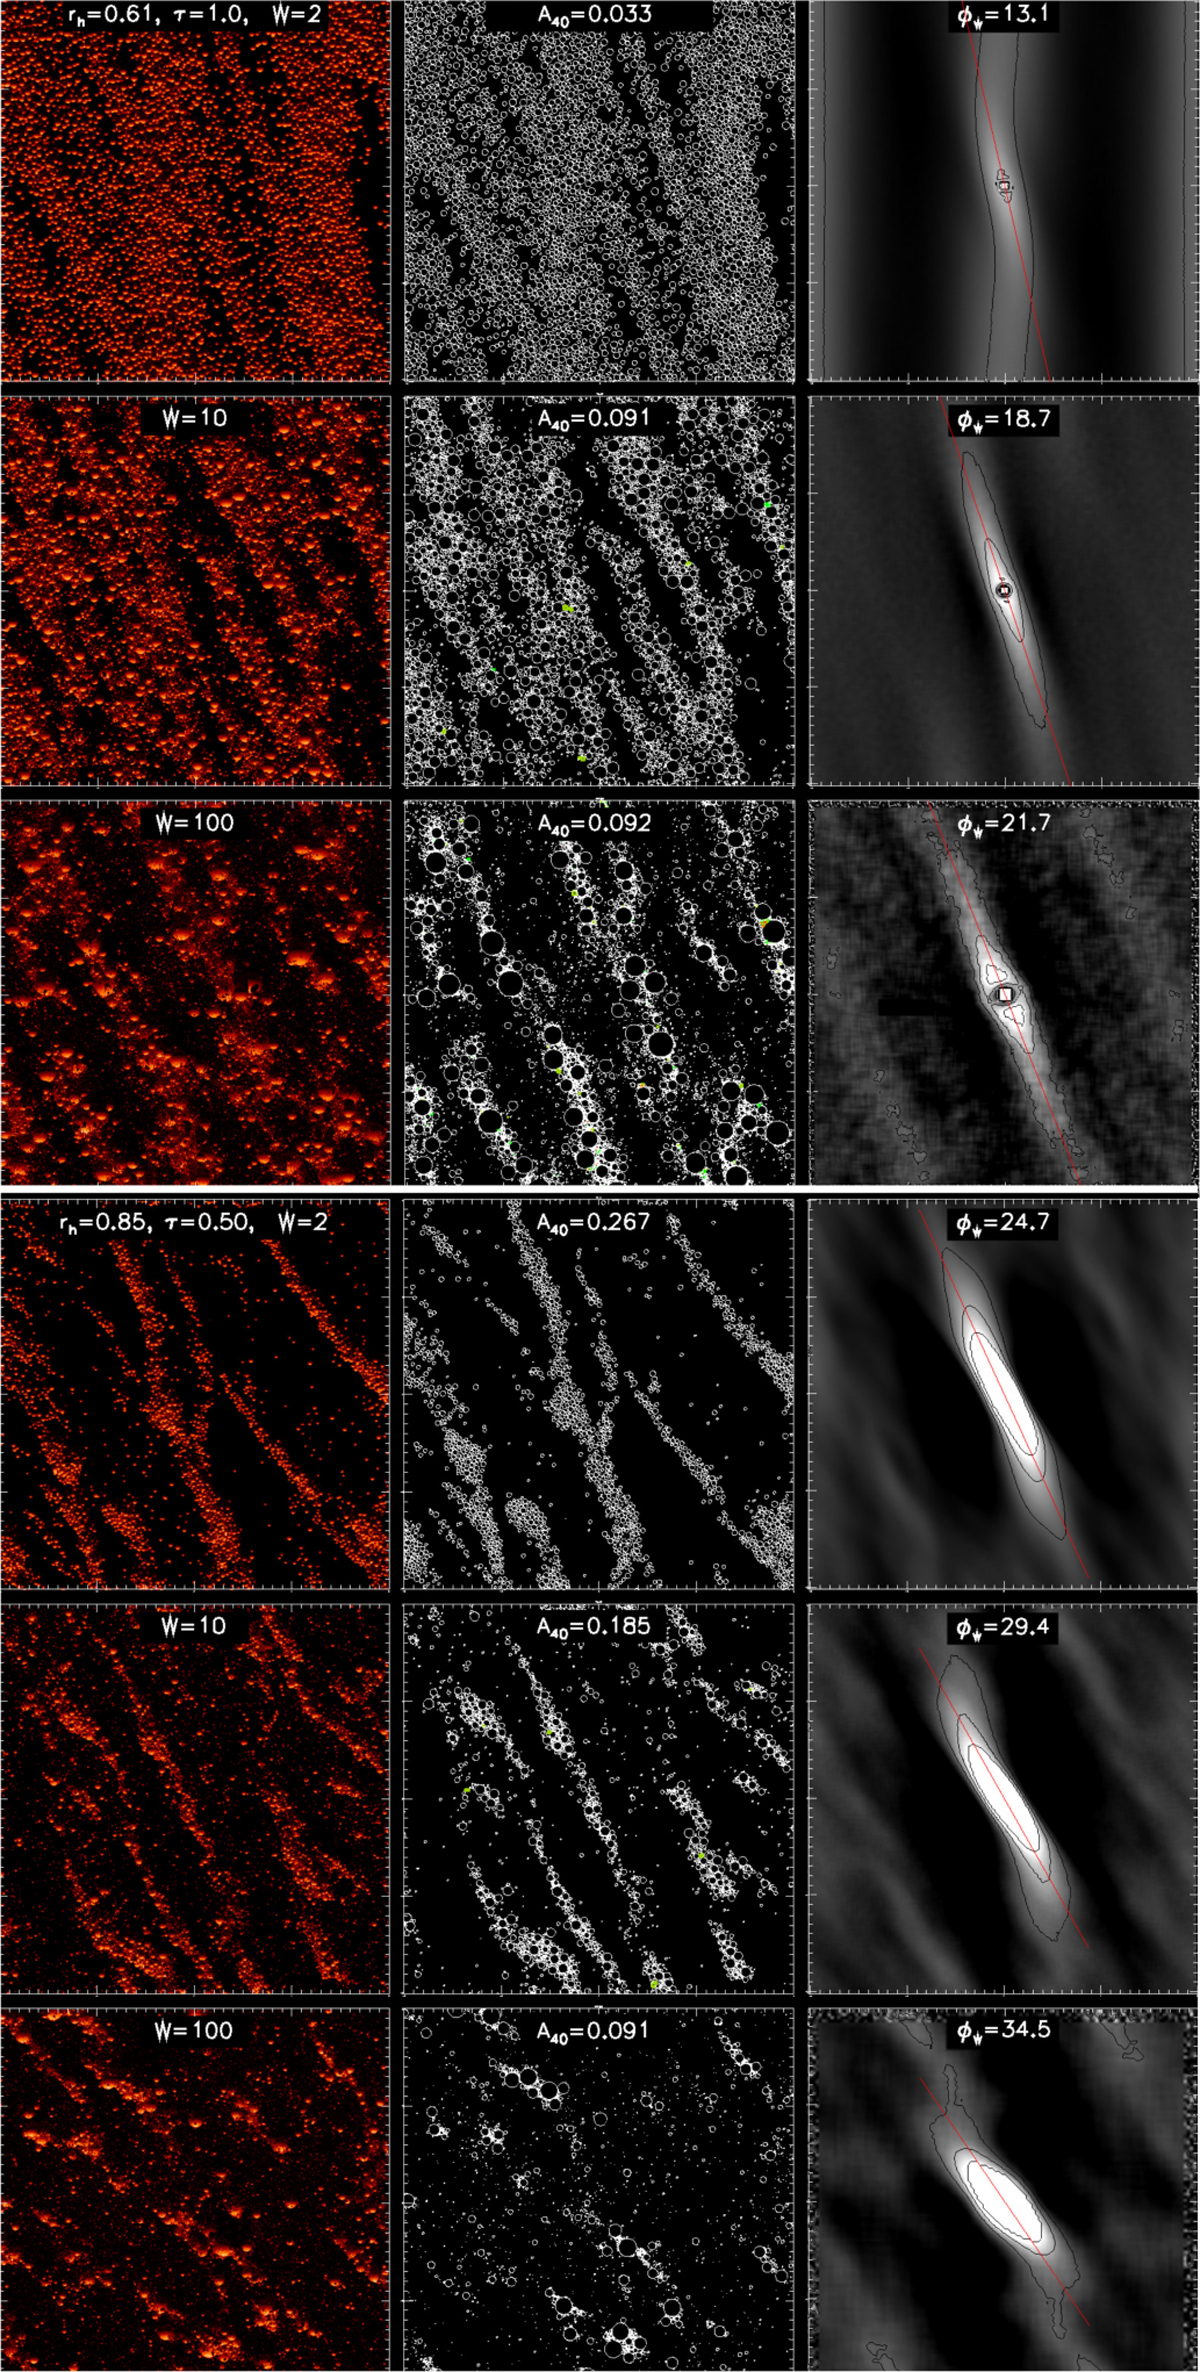
Fig. C.1
Download original image
Examples of simulations with increases width of size distribution, W = 2, 10 and 100. In a) rh = 0.61, τdyn = 1.0 while in b) rh = 0.85, τdyn = 0.5. For each simulation the leftmost frame shows a MC ray tracing image of a typical snapshot, seen from B = 90° viewing direction and illuminated from B′= 25°. A 4λcr × 4λcr region is displayed. The middle frame displays a slice of the same snapshot through the equatorial plane, with the label indicating the A40 asymmetry amplitude calculated for the simulations. The rightmost frames shows a time-averaged surface density autocorrelation function: the label and the red line indicates the effective wake pitch angle calculated from the longitude of minimum I/F. The contour levels correspond to 10%, 30% and 50% overdensities. In all simulations ϵn = 0.1.
Current usage metrics show cumulative count of Article Views (full-text article views including HTML views, PDF and ePub downloads, according to the available data) and Abstracts Views on Vision4Press platform.
Data correspond to usage on the plateform after 2015. The current usage metrics is available 48-96 hours after online publication and is updated daily on week days.
Initial download of the metrics may take a while.