Fig. 22
Download original image
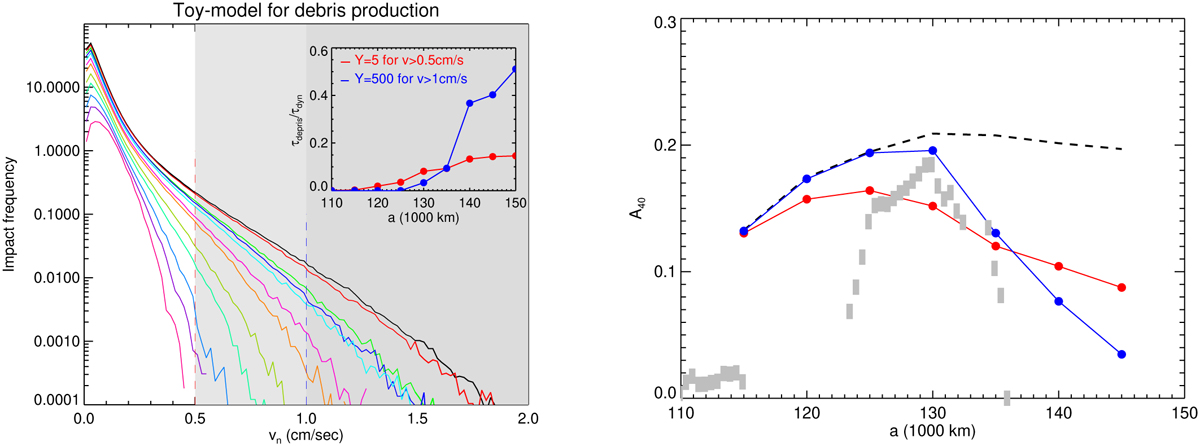
Toy-model for suppression of azimuthal asymmetry due to impact-released debris. The frame in the left shows the distribution of impact velocities in a series of dynamical simulations, performed with τdyn = 0.50, ϵn = 0.5, for rh = 0.72–0.98. Assuming ρ = 450 kg m−3, this corresponds to Saturnocentric distances 110–150 000 km. Shaded regions indicate the frequency of impacts with vn greater than 0.5 and 1.0 cm s−1 : their relative amount increases rapidly, while the mean of impact velocity is nearly constant with distance. The modelled A40 amplitudes are shown in the right frame with a dashed line, while the grey points denote the HST measurements. The red and green curves indicate toy-models with different values for the parameters vthresh and Y: the insert in the left frame displays the amount of free debris as a function of distance following from Eq. (25), while the curves in the right indicate A40 amplitudes in photometric models where the uniform debris population has been added.
Current usage metrics show cumulative count of Article Views (full-text article views including HTML views, PDF and ePub downloads, according to the available data) and Abstracts Views on Vision4Press platform.
Data correspond to usage on the plateform after 2015. The current usage metrics is available 48-96 hours after online publication and is updated daily on week days.
Initial download of the metrics may take a while.