Fig. 2
Download original image
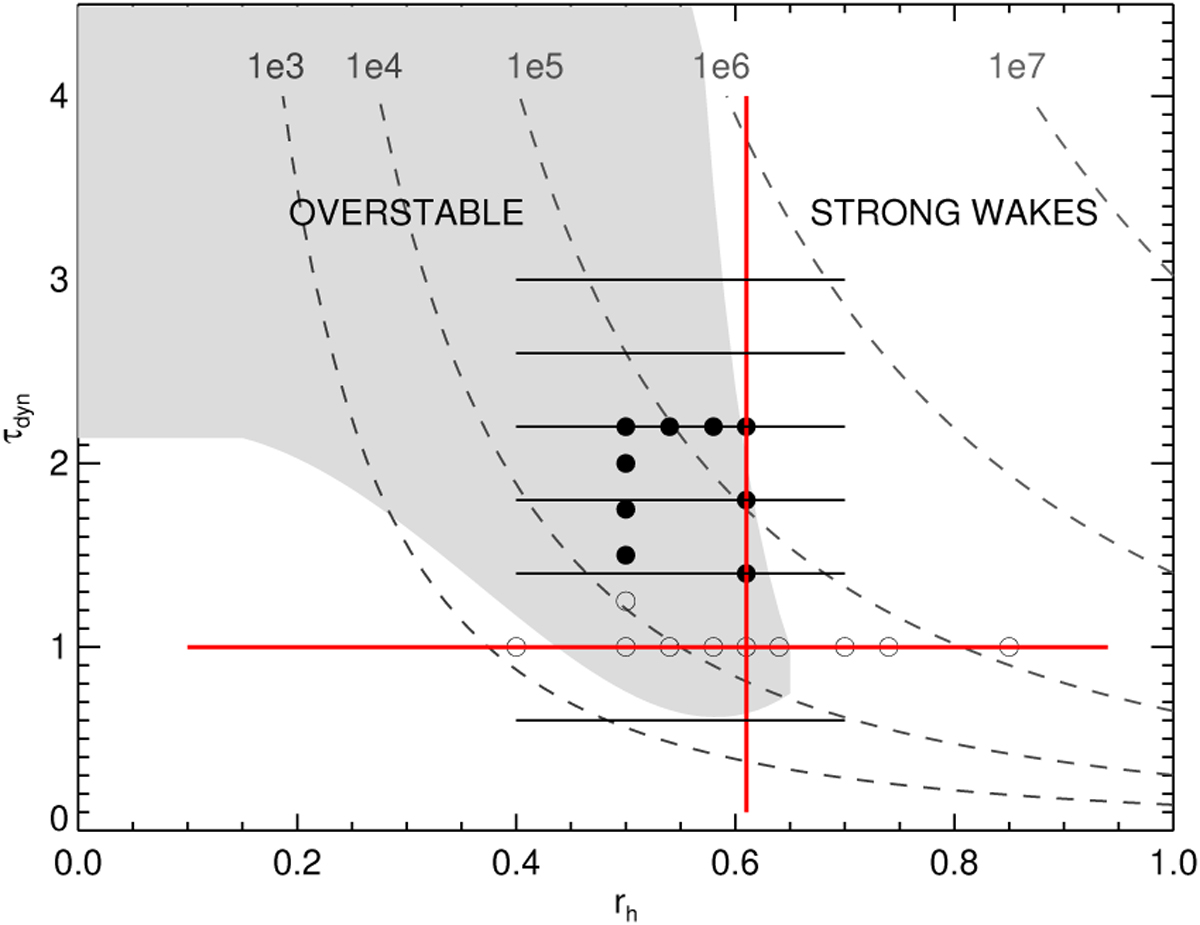
Conducted simulations in rh, τdyn parameter space. Contours indicate the number of simulation particles in the 10λcr × 5λcr runs when identical particles are used (see Eq. (16)). Thick red lines indicate surveys illustrated in Figs. 5 and 7 in Mondino-Llermanos & Salo (2023), while black lines indicate range of other surveys made. Shaded region (from Fig. 10 in Mondino-Llermanos & Salo 2023) indicates the regime where overstability is obtained in simulations with identical particles with ϵn = 0.1. Circles stand for size distribution runs with W = Rmax/Rmin = 20, q = 3, with filled circles indicating overstable cases. In experiments with W = 20, the number of particles is ~7 times larger than indicated by the contours (see Appendix A).
Current usage metrics show cumulative count of Article Views (full-text article views including HTML views, PDF and ePub downloads, according to the available data) and Abstracts Views on Vision4Press platform.
Data correspond to usage on the plateform after 2015. The current usage metrics is available 48-96 hours after online publication and is updated daily on week days.
Initial download of the metrics may take a while.