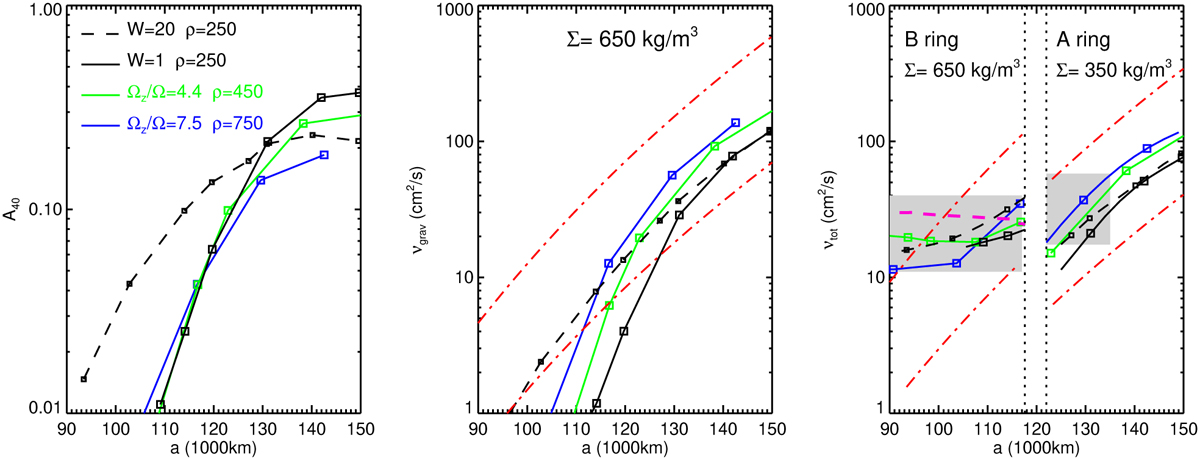
Fig. 19
Download original image
Similar to Fig. 13 except using dimensional values for viscosities. Left frame: A40 vs distance a, assuming ρ = 250 kg m−3 for self-consistent runs with W = 1 and W = 20, and 450 kg m−3 and 750 kg m−3 in hybrid-method simulations with Ωz/Ω = 4.4 and 7.5, respectively. Middle frame: νɡrav, assuming ring surface density Σ = 650 kg m−2, representing typical B ring value (Hedman & Nicholson 2016). Dash-dotted red lines indicate Daisaka et al. (2001) formula (Eq. (14)) for νɡrav, for ρ = 250 kg m−3 and ρ = 900 kg m−3. In the right frame, the shaded regions highlight modeled total viscosities for the B and A ring regions, using Σ = 650 kg m−2 and Σ = 350 kg m−2, respectively. Dash-dotted red curves stand now for Daisaka et al. (2001) formula with νtot = 2νgrav. The dashed purple curve indicates the B ring viscosity estimated in Tajeddine et al. (2017).
Current usage metrics show cumulative count of Article Views (full-text article views including HTML views, PDF and ePub downloads, according to the available data) and Abstracts Views on Vision4Press platform.
Data correspond to usage on the plateform after 2015. The current usage metrics is available 48-96 hours after online publication and is updated daily on week days.
Initial download of the metrics may take a while.