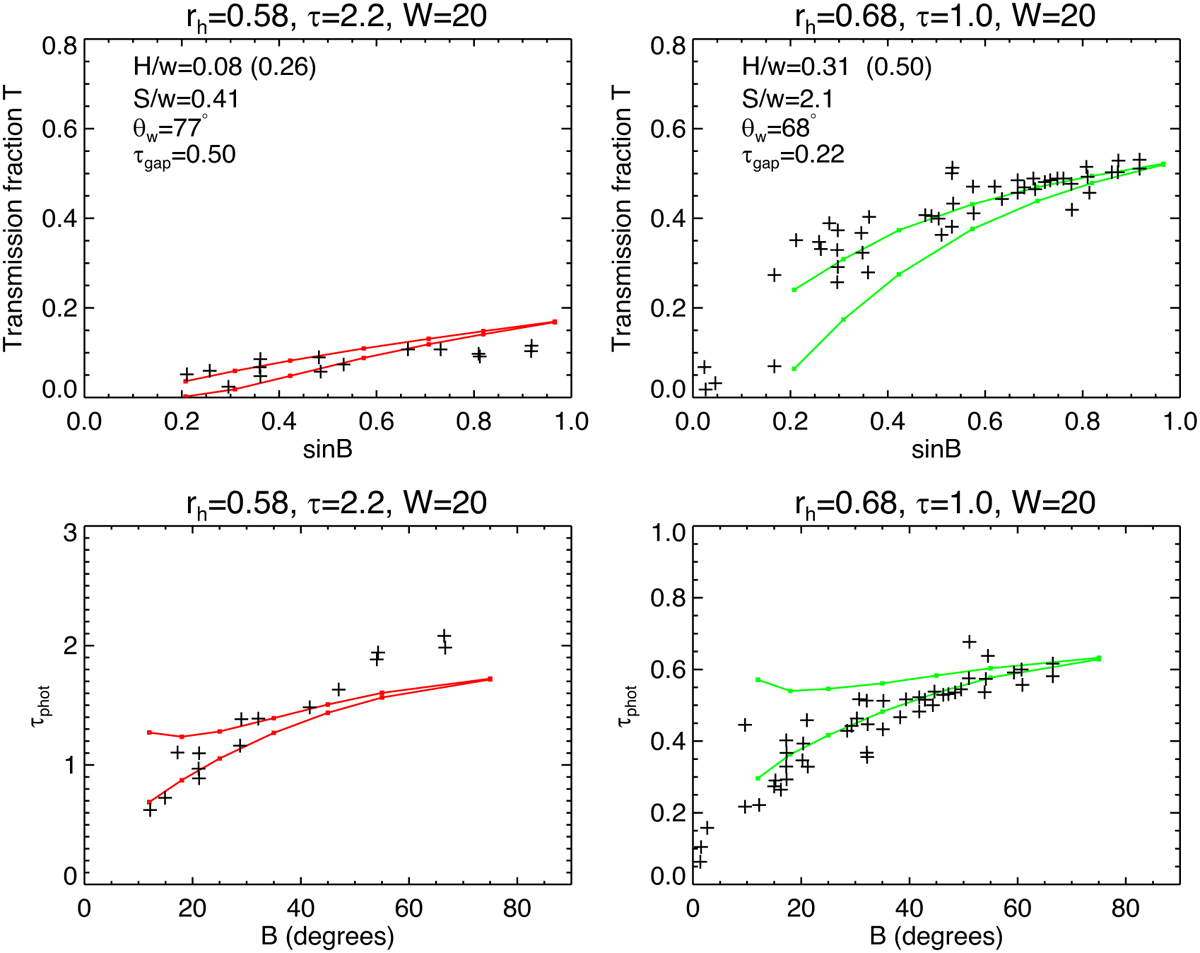
Fig. 18
Download original image
Models for the B ring (rh = 0.58, τdyn = 2.2, left) and the A ring (rh = 0.68, τdyn = 1, right) transparency versus elevation. The upper frame shows the transmission fraction T over sin B, as in Robbins et al. (2010), while the lower frames display the same as τphot versus B, following Colwell et al. (2007). Curves correspond to modelled maximum and minimum transmission over full range of ring longitudes. Size distribution models with W = 20 and ϵn = 0.1 were used. Points stand for B and A ring UVIS occultation data for different ring longitudes, traced from Figs. 5 and 6 in Robbins et al. (2010). Original UVIS data from Colwell et al. (2006, 2007).
Current usage metrics show cumulative count of Article Views (full-text article views including HTML views, PDF and ePub downloads, according to the available data) and Abstracts Views on Vision4Press platform.
Data correspond to usage on the plateform after 2015. The current usage metrics is available 48-96 hours after online publication and is updated daily on week days.
Initial download of the metrics may take a while.