Fig. 16
Download original image
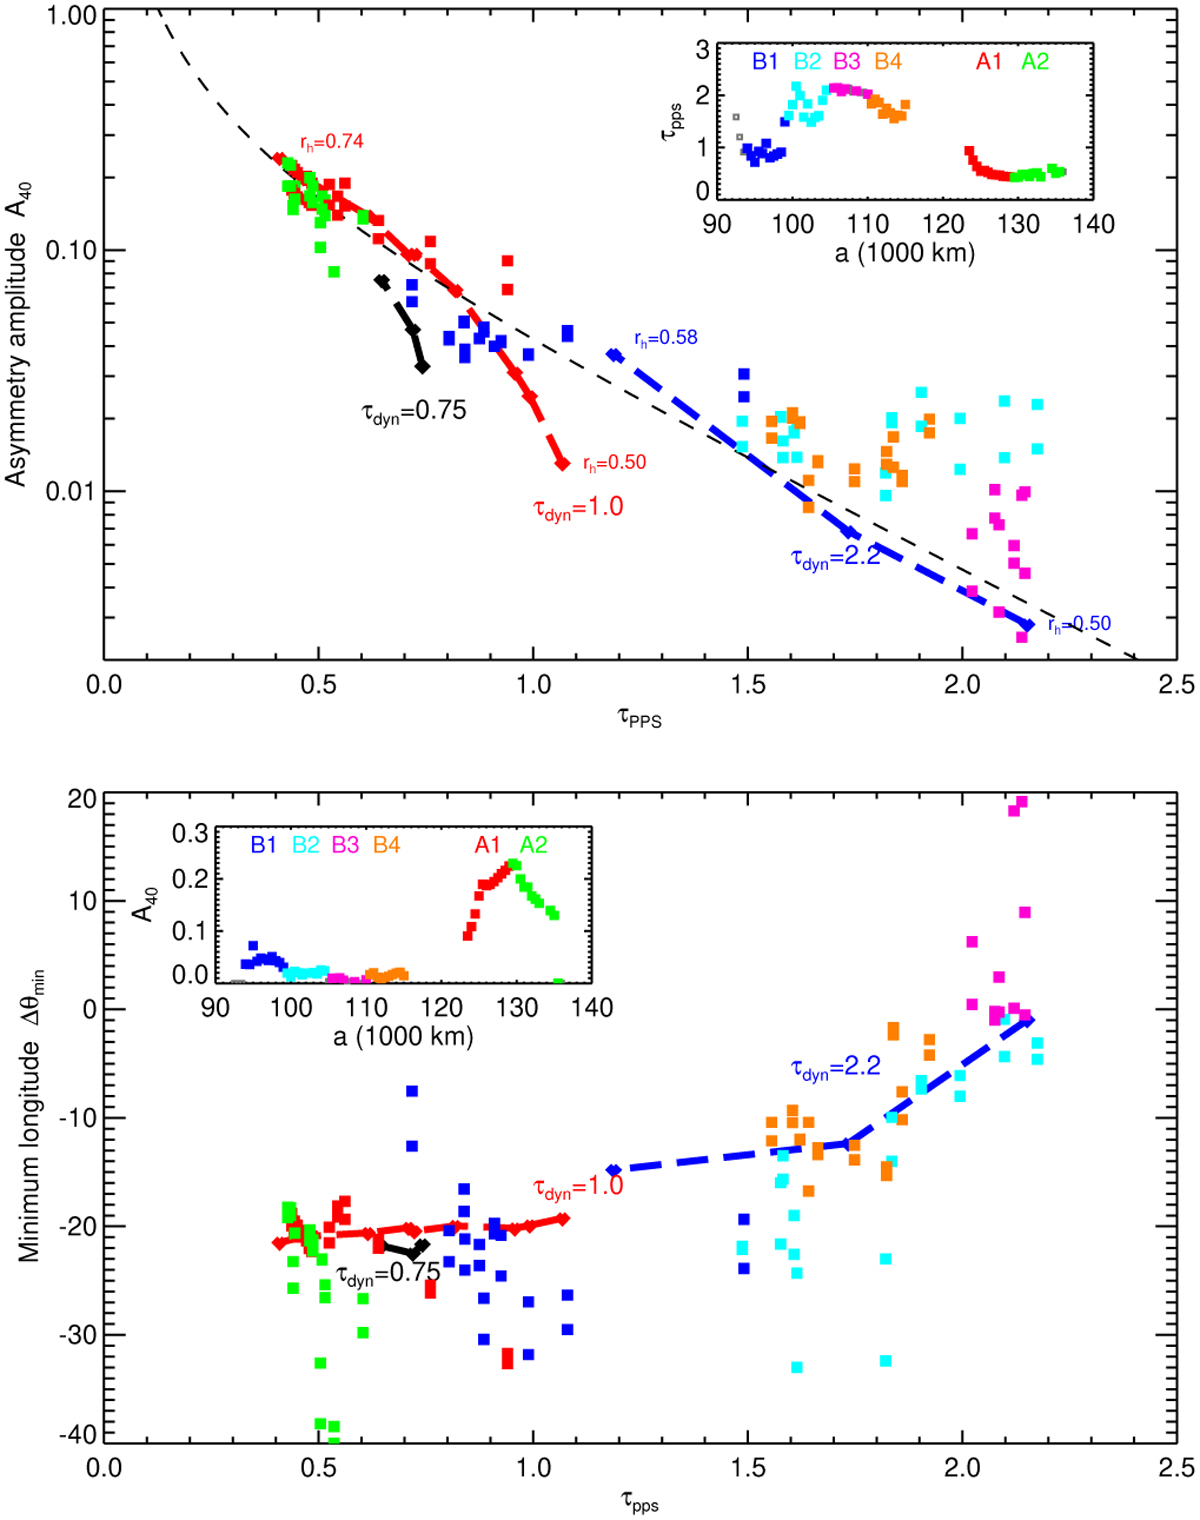
French et al. (2007) HST measurements, A40 (upper frame) and ∆θmin (lower frame) plotted as a function of τpps. The measurements (both Beff = 10° and 15°) are colour-coded according to the ring regions B1-B4 and A1-A2 defined in Colwell et al. (2009); see the insert frames. Thick dashed lines indicate B = B′ = 12° photometric models with W = 20 size distribution, for τdyn = 0.75, 1.0 and 2.2. The thin dashed line in the upper frame corresponds to simple estimate A40 = 0.3T /(1 − T) discussed in the text.
Current usage metrics show cumulative count of Article Views (full-text article views including HTML views, PDF and ePub downloads, according to the available data) and Abstracts Views on Vision4Press platform.
Data correspond to usage on the plateform after 2015. The current usage metrics is available 48-96 hours after online publication and is updated daily on week days.
Initial download of the metrics may take a while.