Fig. 15
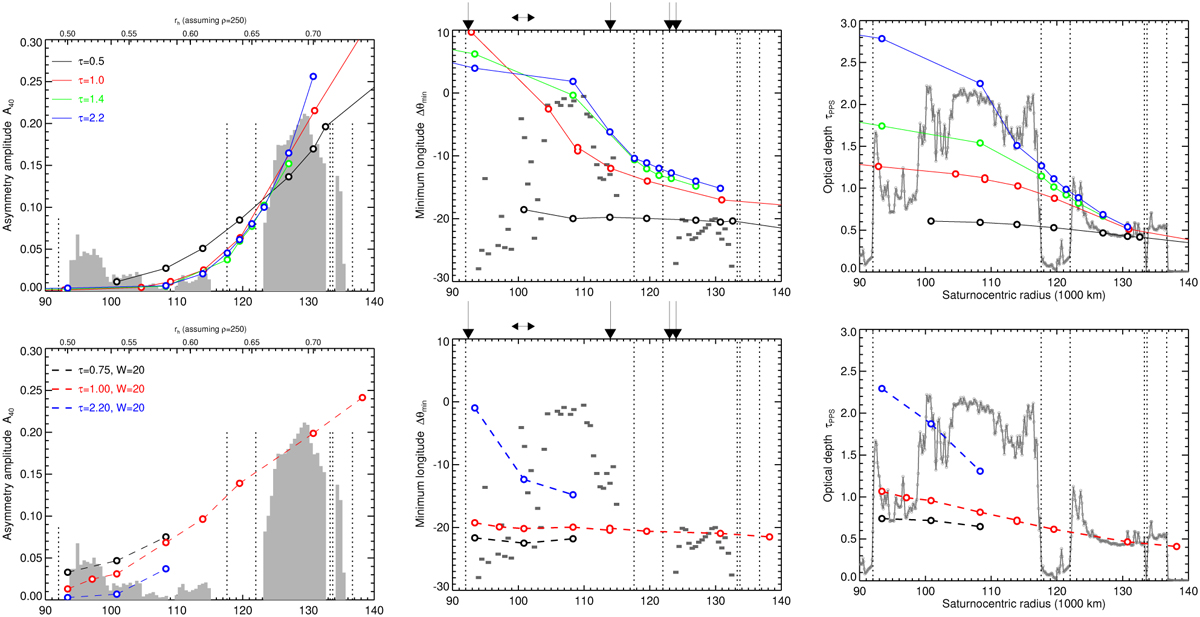
Download original image
Comparison of photometric models to HST asymmetry amplitude A40, minimum longitude ∆θmin, and the PPS optical depth τpps measurements. Both identical particle (upper frames) and W = 20 size distribution models (lower frames) are shown, for various τdyn values indicated by the legends. In all cases ϵn = 0.1 andρ = 250 kg m−3 is assumed. Filled circles indicate simulations leading to overstability. The HST measurements are from French et al. (2007). Arrows mark regions where overstable oscillations have been observed in various studies quoted in the text.
Current usage metrics show cumulative count of Article Views (full-text article views including HTML views, PDF and ePub downloads, according to the available data) and Abstracts Views on Vision4Press platform.
Data correspond to usage on the plateform after 2015. The current usage metrics is available 48-96 hours after online publication and is updated daily on week days.
Initial download of the metrics may take a while.