Fig. 14
Download original image
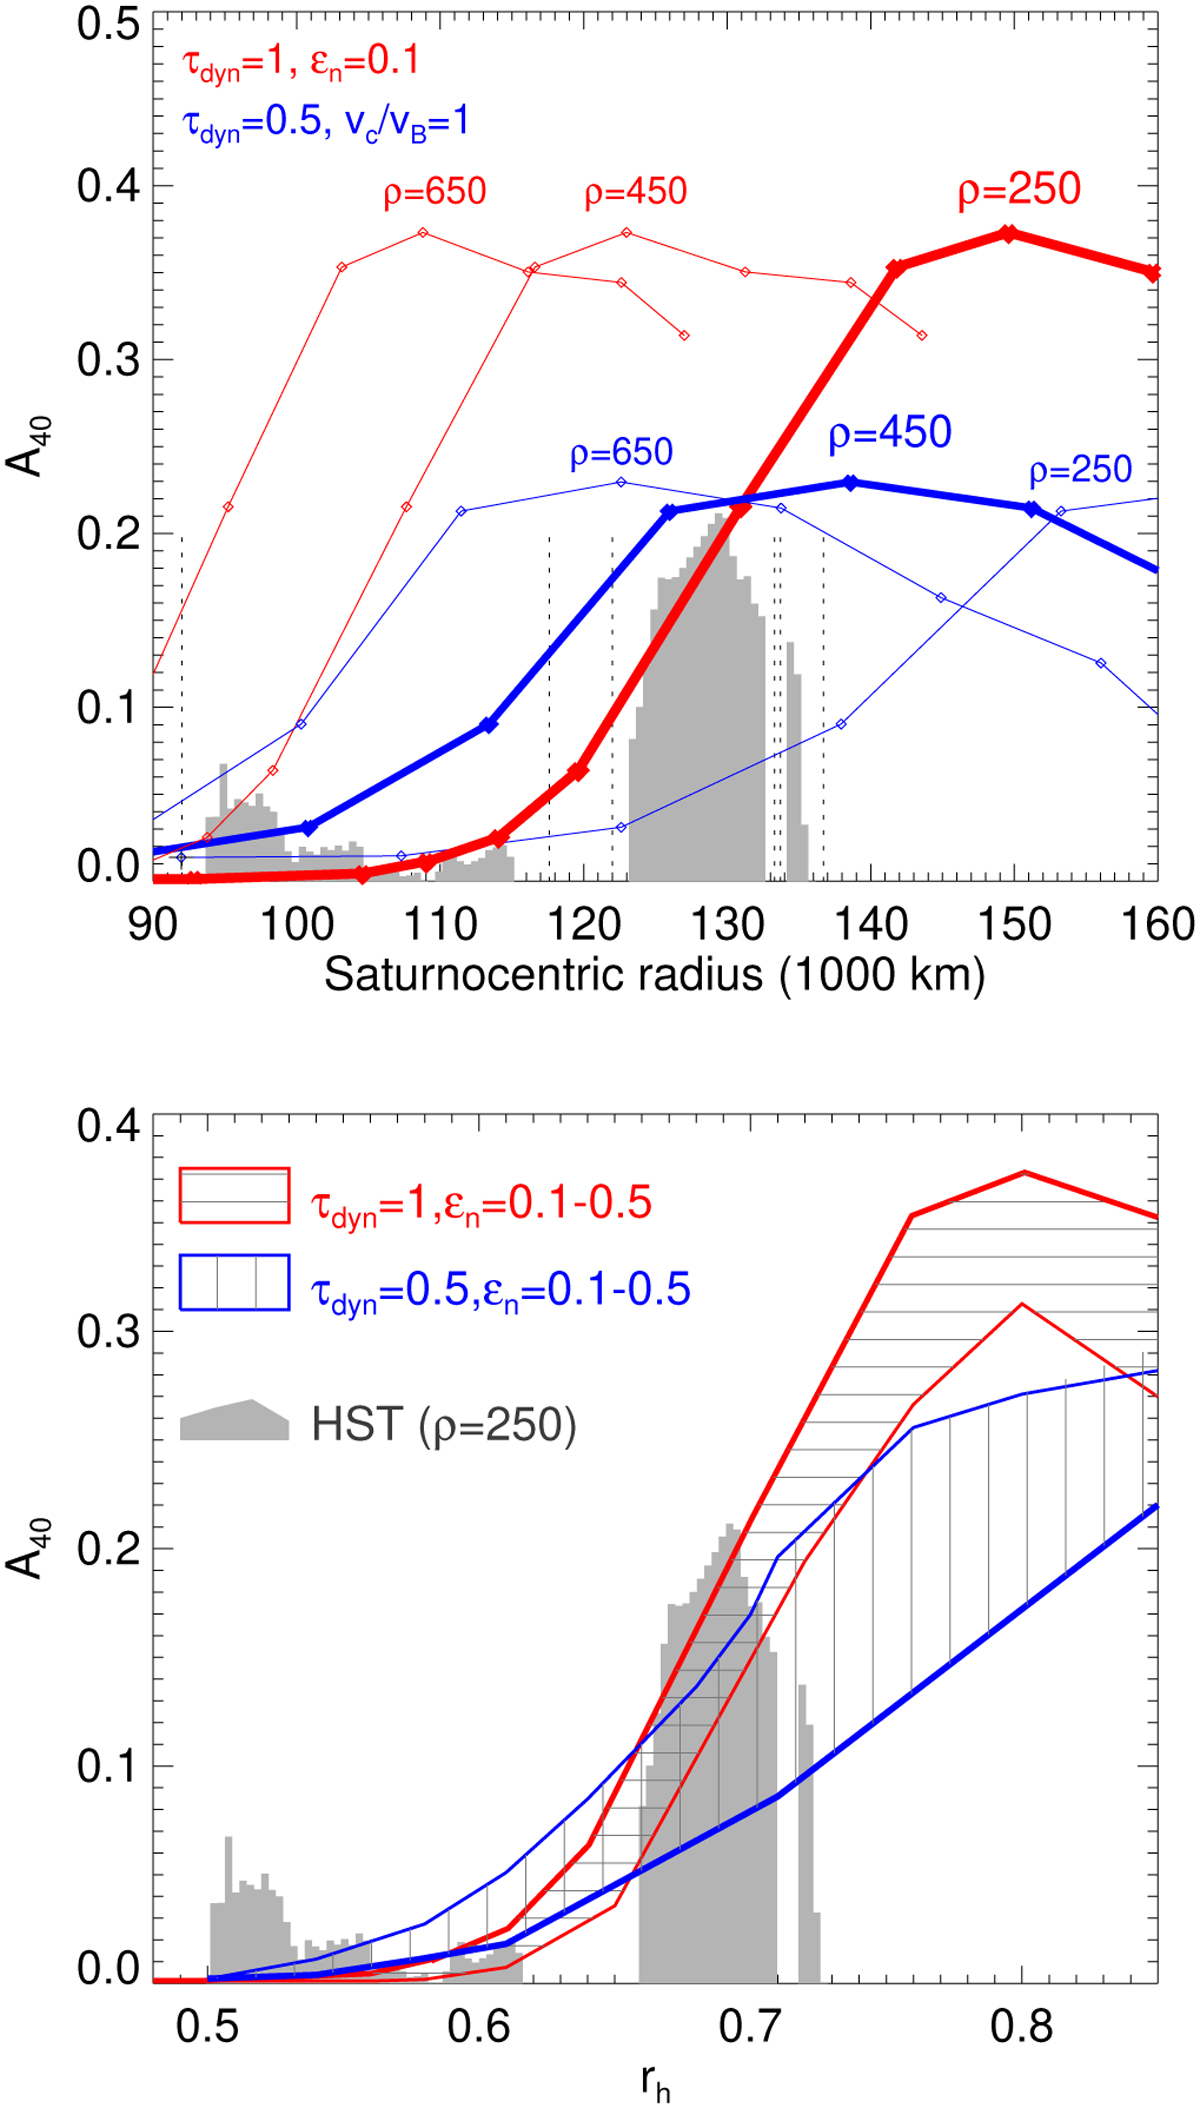
Comparison of asymmetry amplitude A40 in simulations with different dynamical parameters. Upper frame: Blue curves assume to τdyn = 0.5 and velocity-dependent ϵn with vc = vB, as in models of French et al. (2007), while red curves assume τdyn = 1, ϵn = 0.1. Different internal densities ρ = 650, 450, and 250 kg m−3 are compared. Lower frame; comparison of the τdyn = 1.0 and τdyn = 0.5 simulations for ϵn = 0.1 and ϵn = 0.5; the latter elasticity law gives practically identical results to using velocity-dependent ϵn with vc = vB. The models correspond to B = B′= 12° and the HST values are weighted averages of 10° and 15° observations (see Fig. 20 in French et al. 2007).
Current usage metrics show cumulative count of Article Views (full-text article views including HTML views, PDF and ePub downloads, according to the available data) and Abstracts Views on Vision4Press platform.
Data correspond to usage on the plateform after 2015. The current usage metrics is available 48-96 hours after online publication and is updated daily on week days.
Initial download of the metrics may take a while.