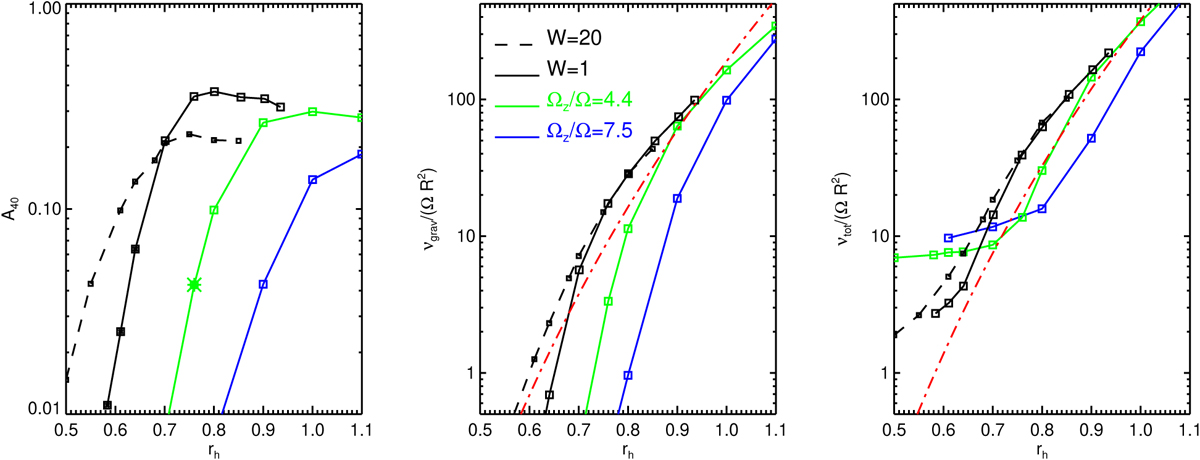
Fig. 13
Download original image
Comparison A40 and νɡrav as a function of rh, collecting different simulation series as indicated by the labels (unless otherwise indicated, τdyn = 1, ϵn = 0.1, W = 1). In the middle frame, νɡrav is shown, while in the right, νtot is. The dash-dotted red curve in the middle frame shows the νɡrav calculated from Eq. (14), while in the right it indicates 2νɡrav.
Current usage metrics show cumulative count of Article Views (full-text article views including HTML views, PDF and ePub downloads, according to the available data) and Abstracts Views on Vision4Press platform.
Data correspond to usage on the plateform after 2015. The current usage metrics is available 48-96 hours after online publication and is updated daily on week days.
Initial download of the metrics may take a while.