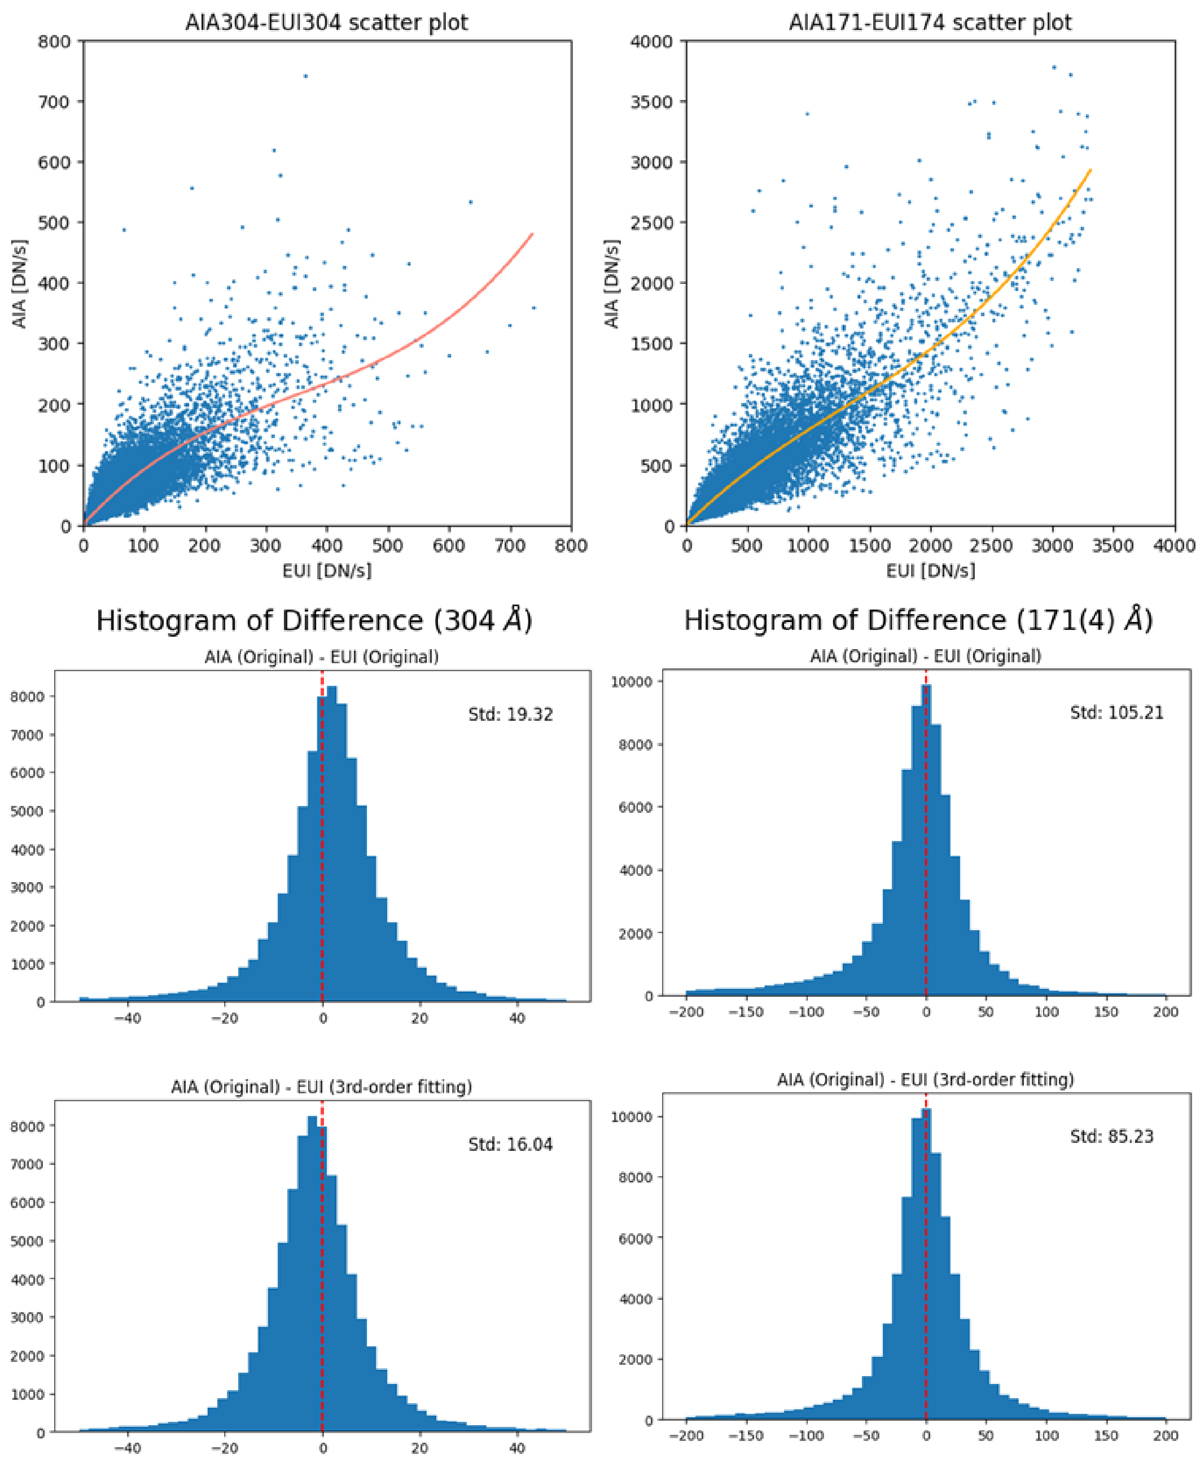
Fig. B.1.
Download original image
Scatter plots and histograms between two datasets. Each column shows the intercalibration between different channel of AIA and EUI. The solid lines in the scatter plots correspond to the third-order fitting, passing through zero, representing the relationship between FSI and AIA. Here, the x-axis corresponds to the DN/s of FSI observations and the y-axis corresponds to the DN/s of AIA observations. The histograms represent the distribution of differences between the original data and differences after third-order fitting. For both wavelengths, the standard deviations improve after intercalibration.
Current usage metrics show cumulative count of Article Views (full-text article views including HTML views, PDF and ePub downloads, according to the available data) and Abstracts Views on Vision4Press platform.
Data correspond to usage on the plateform after 2015. The current usage metrics is available 48-96 hours after online publication and is updated daily on week days.
Initial download of the metrics may take a while.