Fig. 4.
Download original image
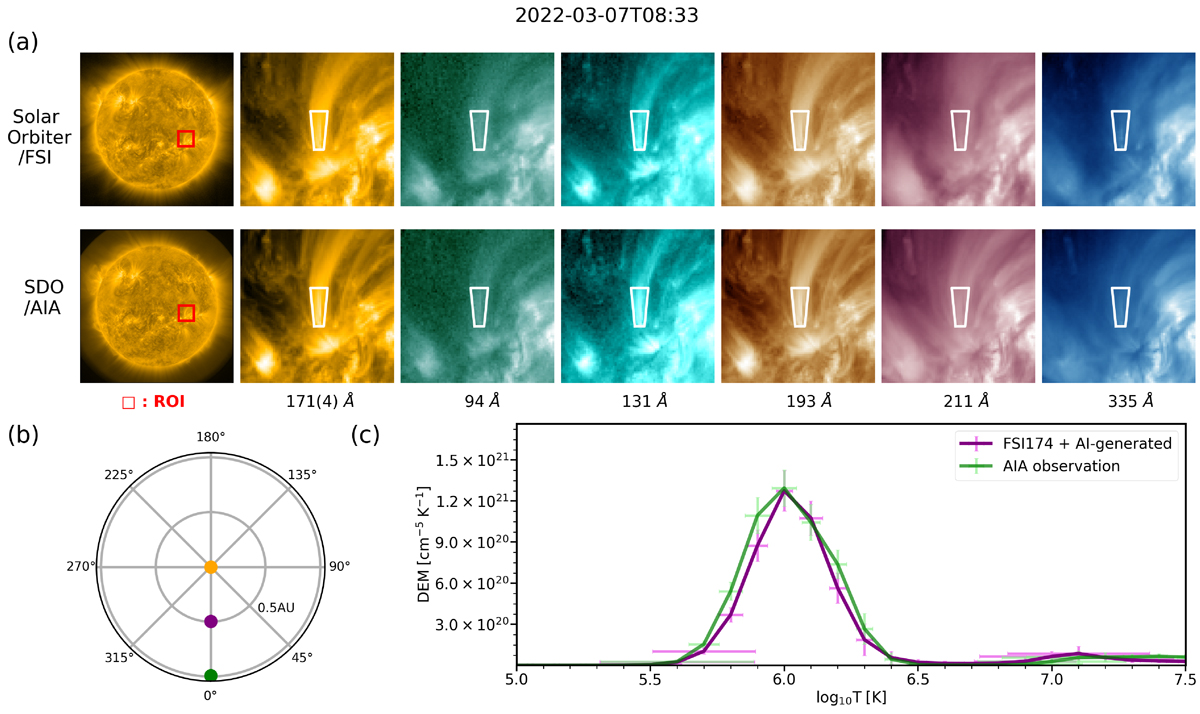
Results of the DEM calculation at 08:33 UT on 2022 March 07. (a) ROI for the DEM calculations. The red box in the first column of images marks the region shown in the remaining column of images. The white contour in the remaining column highlights the specific ROI. (b) Positions of the Solar Orbiter (purple dot) and SDO (green dot). (c) Comparison of DEM results from FSI 174 Å + AI-generated (purple line) images and AIA images. The vertical error bars represent the uncertainties of the DEM values, while the horizontal error bars indicate the temperature resolution.
Current usage metrics show cumulative count of Article Views (full-text article views including HTML views, PDF and ePub downloads, according to the available data) and Abstracts Views on Vision4Press platform.
Data correspond to usage on the plateform after 2015. The current usage metrics is available 48-96 hours after online publication and is updated daily on week days.
Initial download of the metrics may take a while.