Fig. 5
Download original image
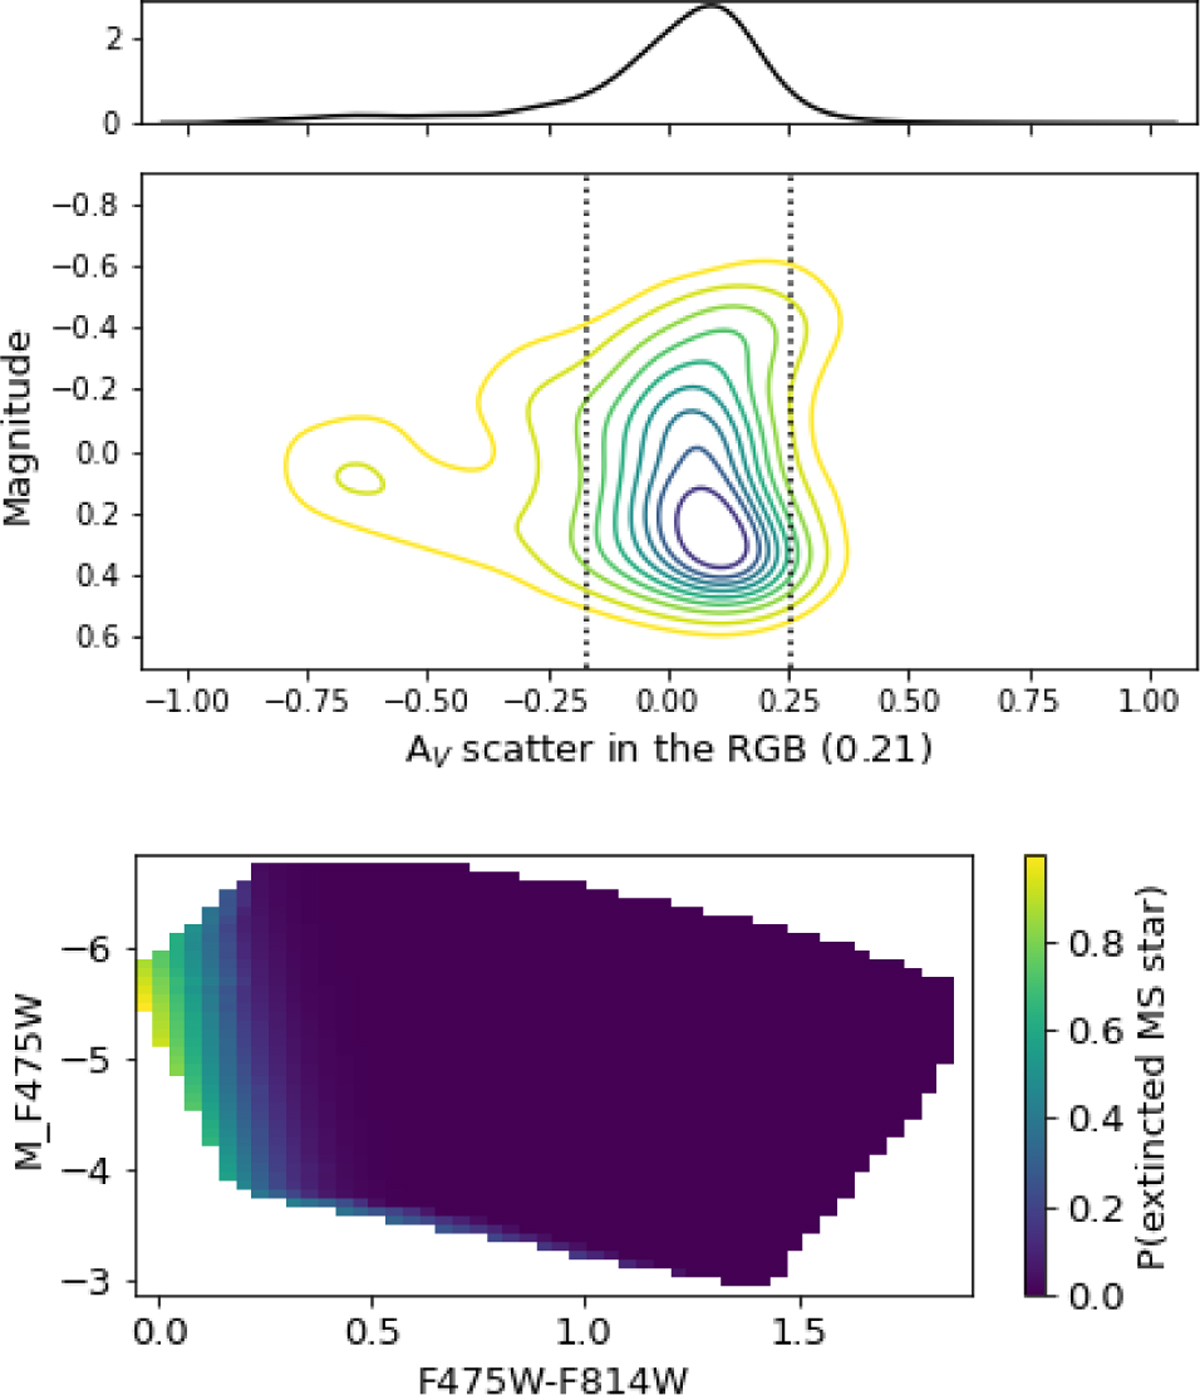
Estimation of IC 1613 internal extinction. Top: density plot of the RGB of IC 1613 in the magnitude vs. relative AV plane. The x-axis zero point corresponds to the mean of the distribution. The top curve shows the kernel density estimation of AV values, with a standard deviation of ± 0.21 (dotted lines). Bottom: resulting map showing the probability of a YSG being an extinguished MS star in the selection region of YSG sources in the IC 1613 galaxy.
Current usage metrics show cumulative count of Article Views (full-text article views including HTML views, PDF and ePub downloads, according to the available data) and Abstracts Views on Vision4Press platform.
Data correspond to usage on the plateform after 2015. The current usage metrics is available 48-96 hours after online publication and is updated daily on week days.
Initial download of the metrics may take a while.