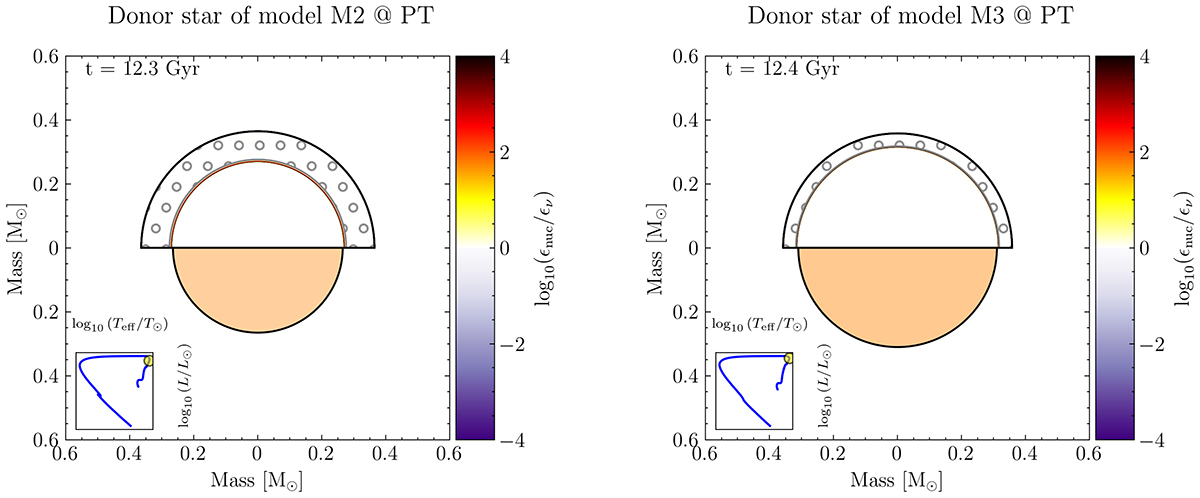
Fig. 4.
Download original image
Structure of the donor star. The top half of each figure shows the energy generation and interior mixing of the donor star at the time of the phase transition for M2 (left) and M3 (right). The bottom half shows the helium core mass and the color of the star based on its surface temperature. The yellow circle in the inline plot shows their position on a standard Hertzsprung-Russell diagram; the x-axis is the logarithm of the effective temperature, and the y-axis is the logarithm of surface luminosity. Dotted areas depict regions where convection is the dominant mixing mechanism.
Current usage metrics show cumulative count of Article Views (full-text article views including HTML views, PDF and ePub downloads, according to the available data) and Abstracts Views on Vision4Press platform.
Data correspond to usage on the plateform after 2015. The current usage metrics is available 48-96 hours after online publication and is updated daily on week days.
Initial download of the metrics may take a while.