Fig. 3.
Download original image
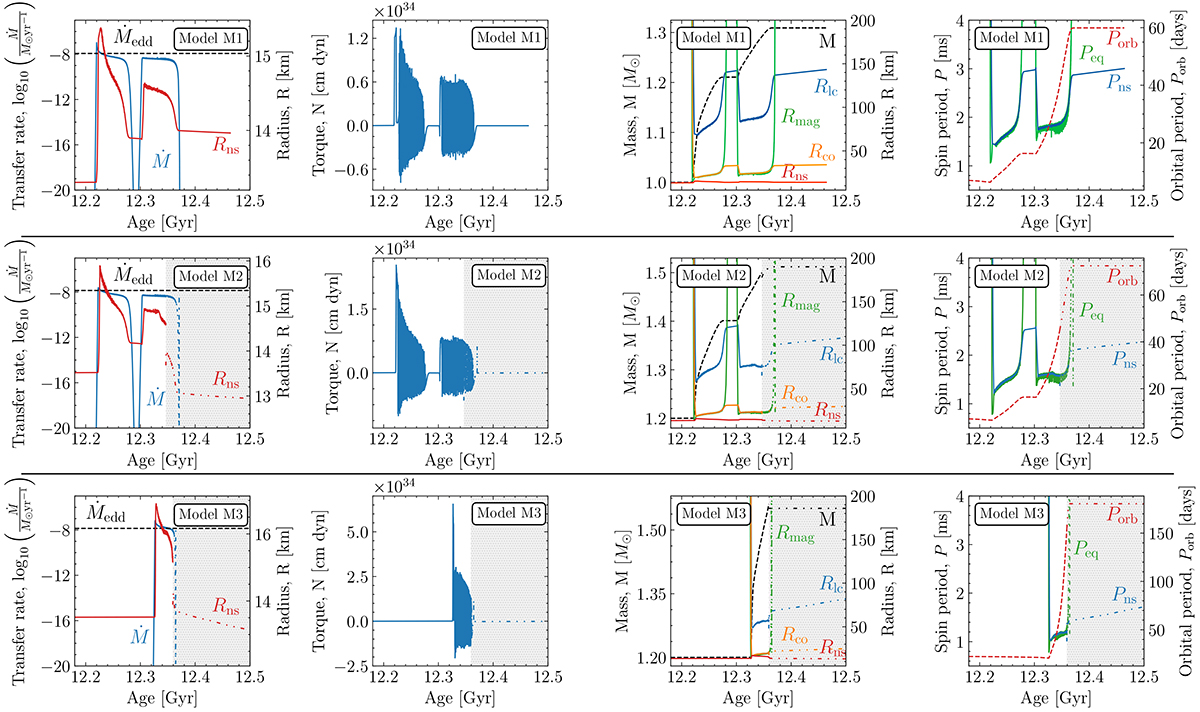
Time evolution of M1 (top panel), M2 (middle panel), and M3 (bottom panel). The first column shows the evolution of mass-transfer rate (left y-axis) and NS radius (right y-axis). The second column shows the accretion torque. The third column shows the NS mass (left y-axis, dashed black line) and various radii (right y-axis: magnetic, corotation, light-cylinder, and NS radius). The fourth column shows the spin period (left y-axis) and orbital period (right y-axis). Gray regions indicate post-transition evolution, with non-solid tracks for M2 and M3. For a detailed description of the three spin evolution scenarios, see the main text.
Current usage metrics show cumulative count of Article Views (full-text article views including HTML views, PDF and ePub downloads, according to the available data) and Abstracts Views on Vision4Press platform.
Data correspond to usage on the plateform after 2015. The current usage metrics is available 48-96 hours after online publication and is updated daily on week days.
Initial download of the metrics may take a while.