Fig. 1.
Download original image
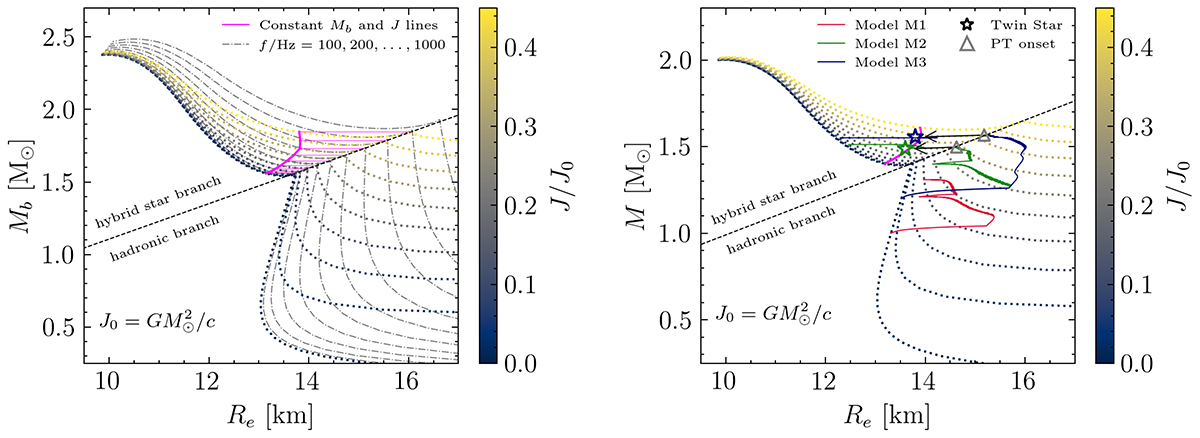
Left Panel: Baryonic mass vs. equatorial radius. Dotted and dot-dashed curves indicate lines of constant angular momentum and constant frequency, respectively. The dashed black line highlights the points of maximum stability in the hadronic branches, signaling the onset of a phase transition (PT). Thin, horizontal magenta lines show trajectories where angular momentum (J) and baryonic mass (Mb) are conserved. The thick magenta curve connects points on the hybrid star branches that can be reached through a collapse conserving both J and Mb. Right Panel: Similar to the left panel, but with the y-axis representing gravitational mass. Star markers denote the endpoint trajectories for direct (M2) and delayed (M3) collapse models. The arrows are inclined because gravitational mass, unlike baryonic mass, is not conserved during the PT.
Current usage metrics show cumulative count of Article Views (full-text article views including HTML views, PDF and ePub downloads, according to the available data) and Abstracts Views on Vision4Press platform.
Data correspond to usage on the plateform after 2015. The current usage metrics is available 48-96 hours after online publication and is updated daily on week days.
Initial download of the metrics may take a while.