Open Access
Fig. 10
Download original image
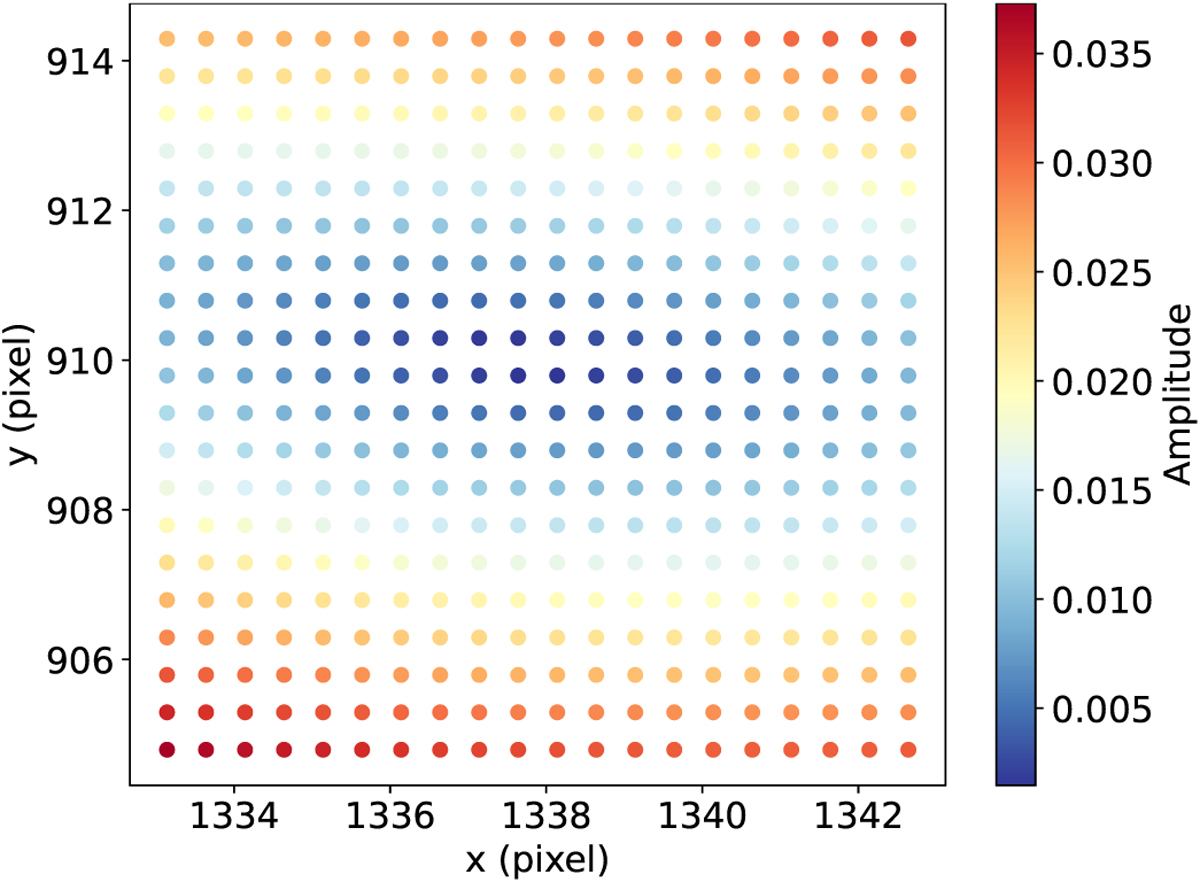
Result of the centre fitting. Each point is a centre position, while x, y are in pixels. The colour of each point refers to the amplitude, A, of the sinusoidal signal calculated with the exact centre. Theoretically, the optical centre is located where A = 0. We used two-dimensional fitting to find the best centre position.
Current usage metrics show cumulative count of Article Views (full-text article views including HTML views, PDF and ePub downloads, according to the available data) and Abstracts Views on Vision4Press platform.
Data correspond to usage on the plateform after 2015. The current usage metrics is available 48-96 hours after online publication and is updated daily on week days.
Initial download of the metrics may take a while.