Fig. 5
Download original image
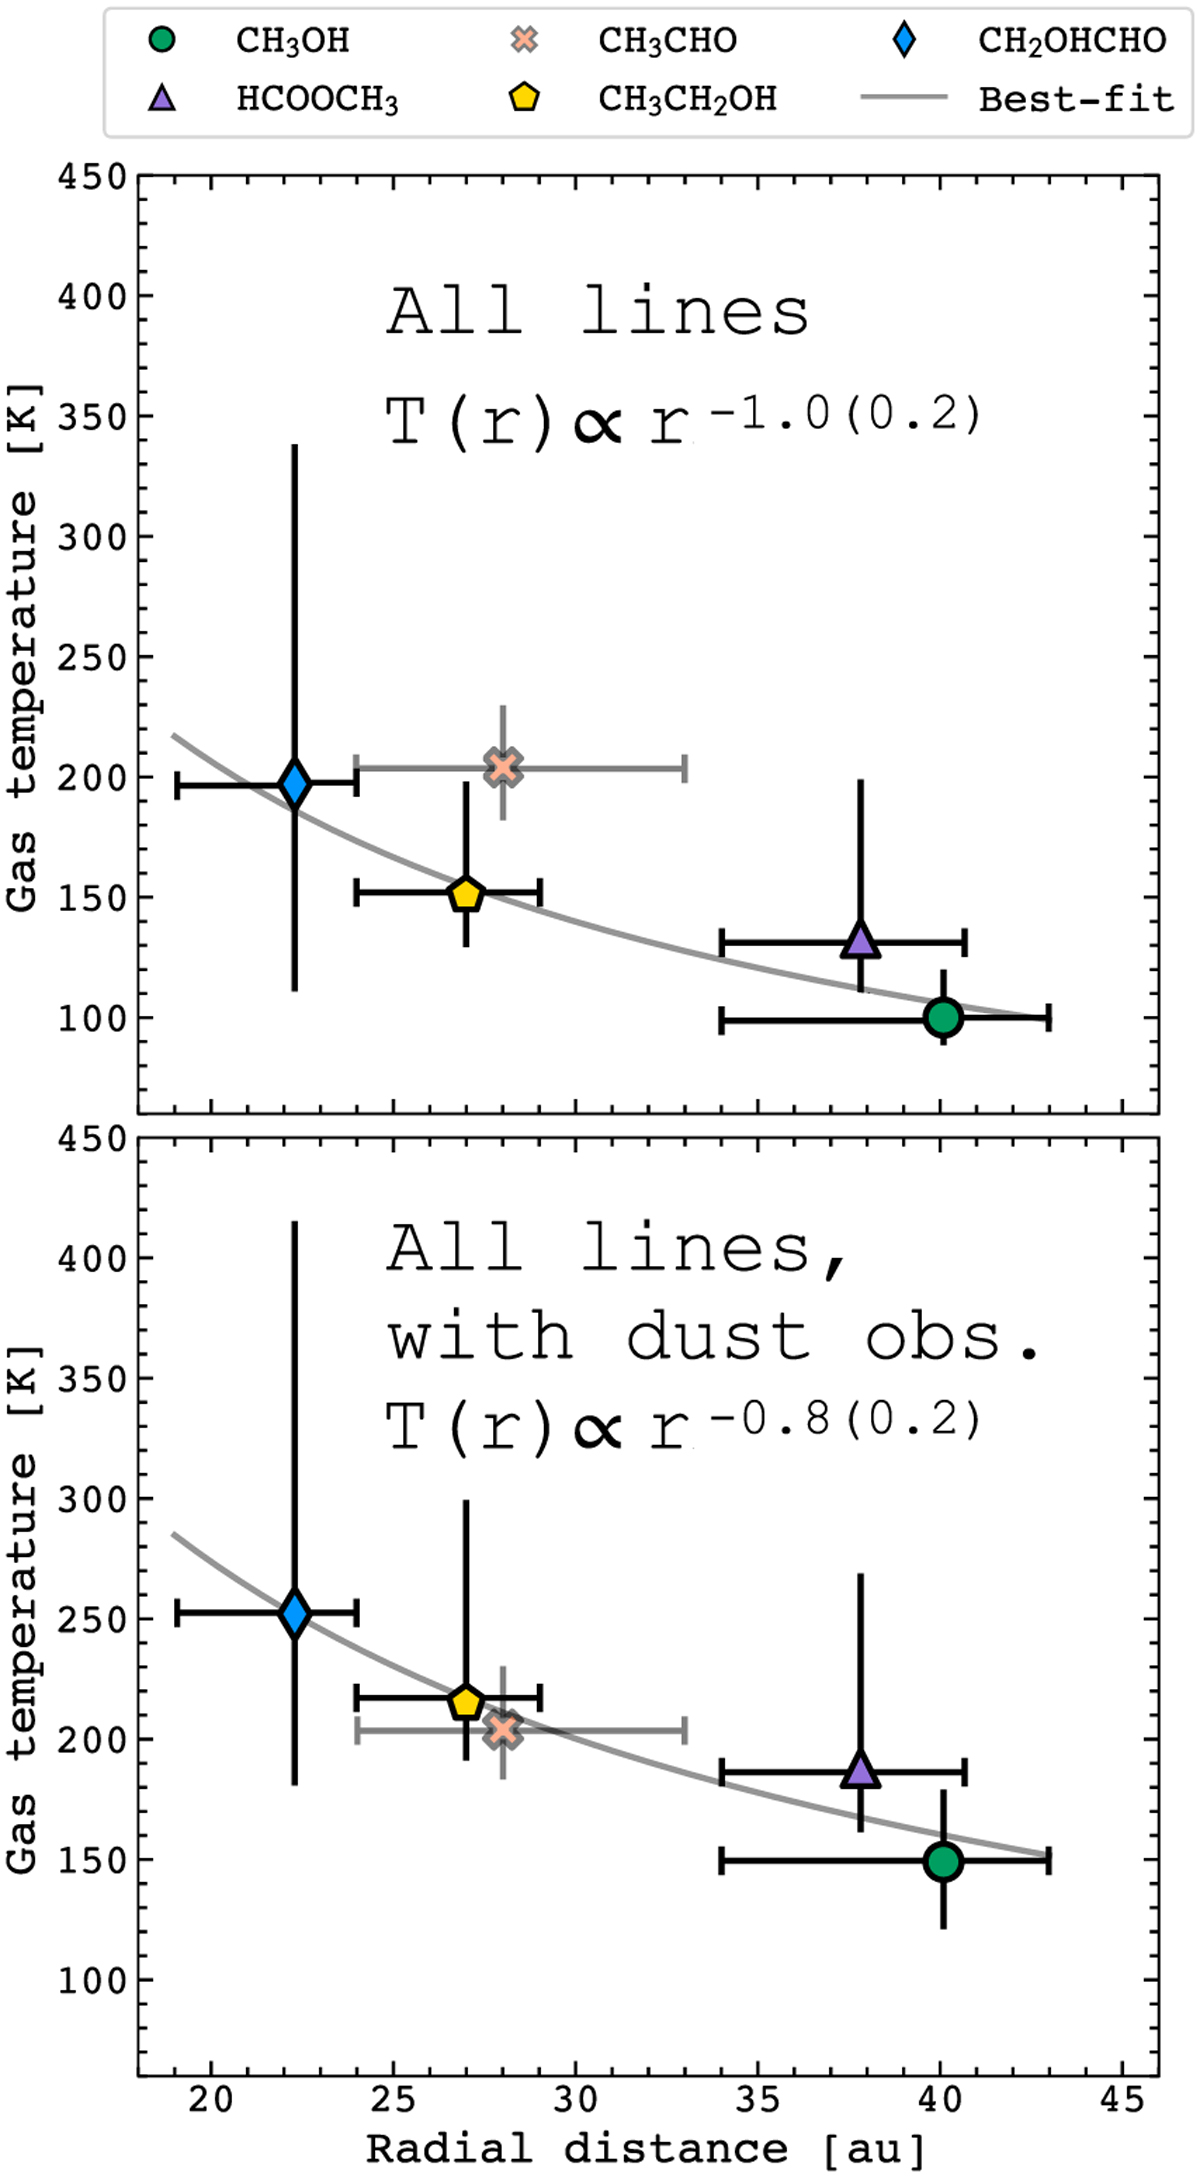
T–r profile of IRAS 4A2. The gas temperatures are derived accounting for all transitions and for the millimeter dust obscuration (bottom). The colored data points mark the best-fit gas temperature derived for each species as a function of the average emitting radius r̄. The emitting radius error bar encompasses the observed range of sizes per species. The error bar on the temperature is the 1σ confidence range of the LTE rotational diagram analysis (CH3CHO), of the LTE population diagram analysis (HCOOCH3, CH3CH2OH, and CH2OHCHO), and of the non-LTE LVG analysis for CH3OH. The gray solid line in both panels is the best fit to the data points excluding CH3CHO (see Sect. 3.2).
Current usage metrics show cumulative count of Article Views (full-text article views including HTML views, PDF and ePub downloads, according to the available data) and Abstracts Views on Vision4Press platform.
Data correspond to usage on the plateform after 2015. The current usage metrics is available 48-96 hours after online publication and is updated daily on week days.
Initial download of the metrics may take a while.