Fig. 4

Download original image
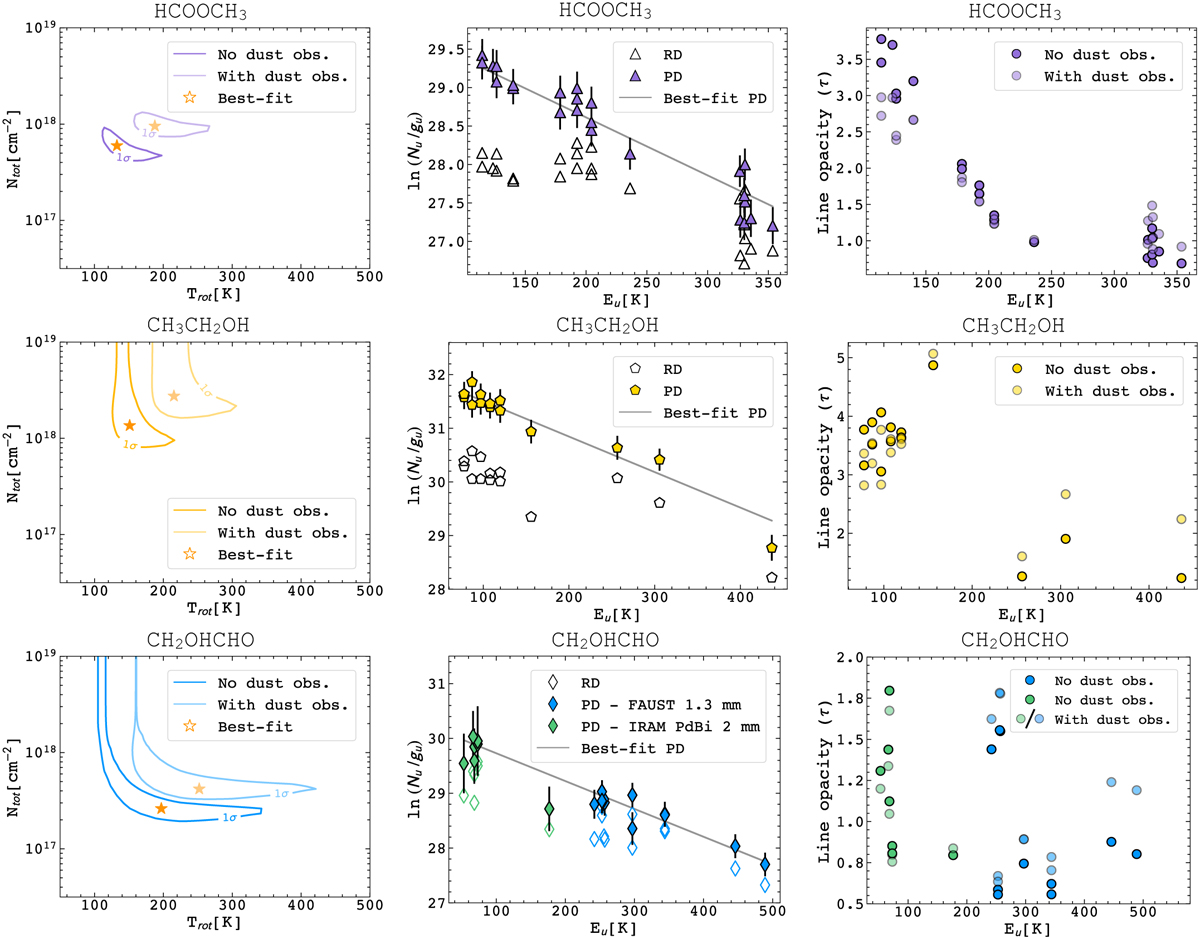
LTE population diagrams (PD) of methyl formate (HCOOCH3), ethanol (CH3CH2OH), and glycolaldehyde (CH2OHCHO). For CH2OHCHO, we complemented our dataset (blue diamonds) with the dataset of Taquet et al. (2015) (green diamonds). The results are plotted with (shaded) and without (full color) the millimeter dust obscuration factor. Left: column density-temperature reduced ![]() contour plots. The shaded and solid colored lines indicate the 1σ confidence ranges. The star marks the best-fit value in the two cases. Center: observed transitions corrected for the line opacity calculated at the best-fit values. The gray solid line refers to the best-fit of the data points (not corrected for dust obscuration). Empty markers indicate the points not corrected for line opacity, whose fit is the rotational diagram (RD). Right: line opacity as a function of the upper-state energy of the best-fit values.
contour plots. The shaded and solid colored lines indicate the 1σ confidence ranges. The star marks the best-fit value in the two cases. Center: observed transitions corrected for the line opacity calculated at the best-fit values. The gray solid line refers to the best-fit of the data points (not corrected for dust obscuration). Empty markers indicate the points not corrected for line opacity, whose fit is the rotational diagram (RD). Right: line opacity as a function of the upper-state energy of the best-fit values.
Current usage metrics show cumulative count of Article Views (full-text article views including HTML views, PDF and ePub downloads, according to the available data) and Abstracts Views on Vision4Press platform.
Data correspond to usage on the plateform after 2015. The current usage metrics is available 48-96 hours after online publication and is updated daily on week days.
Initial download of the metrics may take a while.


