Fig. 2
Download original image
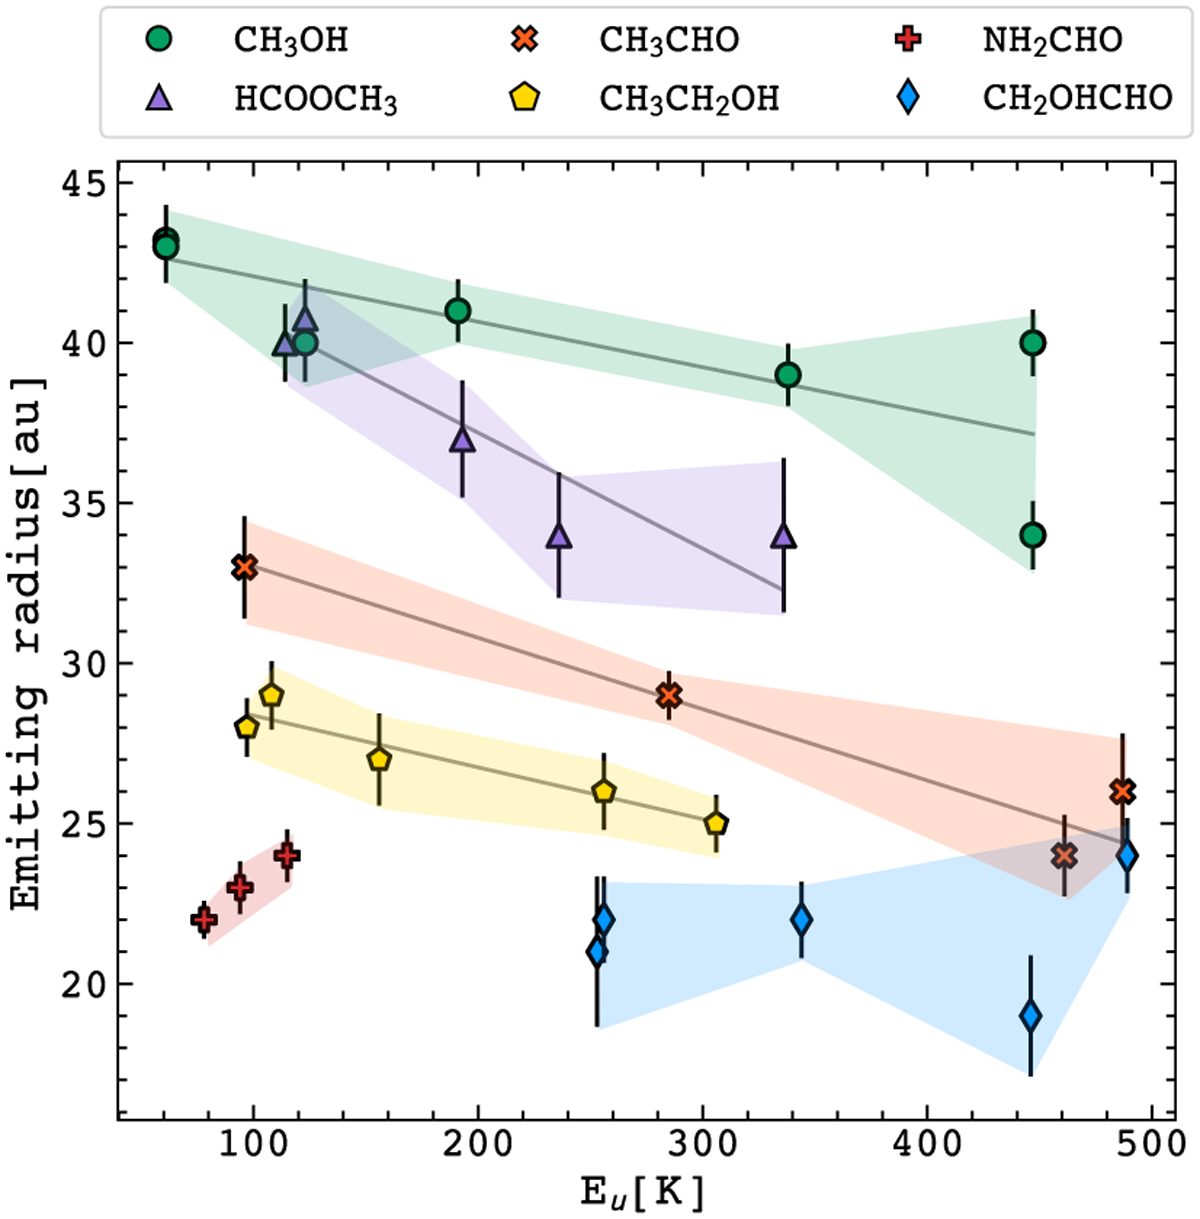
iCOM beam-deconvolved radius as a function of the line upperstate energy. The colored markers correspond to a chosen sample (see Sect. 3.1 and the Appendices online) of imaged and fitted iCOM transitions. The gray solid lines indicate the linear fit performed on the derived radius. The shaded colored regions highlight the emitting regions associated with each iCOM.
Current usage metrics show cumulative count of Article Views (full-text article views including HTML views, PDF and ePub downloads, according to the available data) and Abstracts Views on Vision4Press platform.
Data correspond to usage on the plateform after 2015. The current usage metrics is available 48-96 hours after online publication and is updated daily on week days.
Initial download of the metrics may take a while.