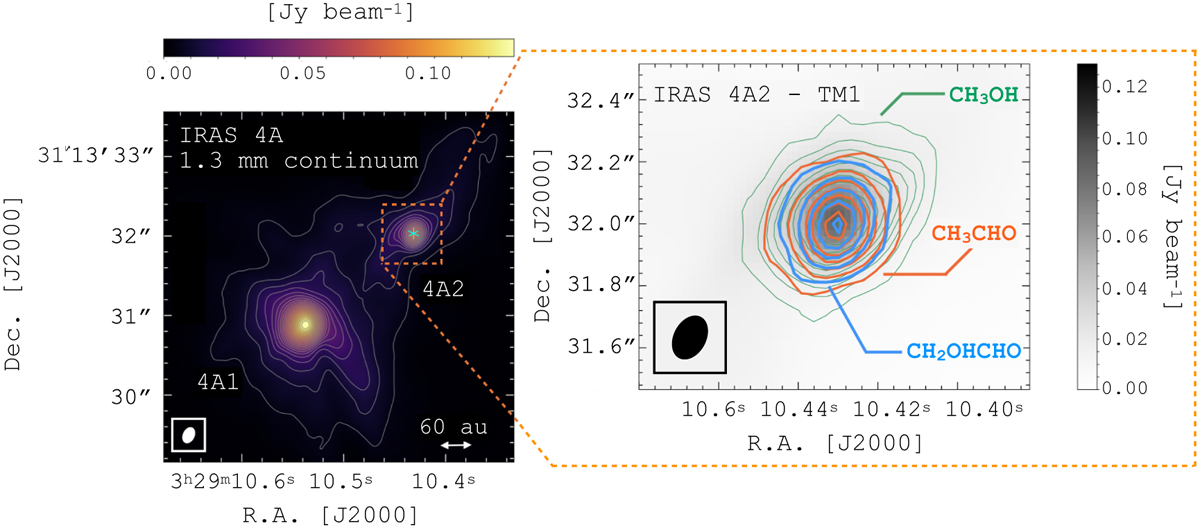
Fig. 1
Download original image
Dust continuum and emission of selected iCOM transitions toward IRAS 4A2. Left: 1.3 mm dust continuum emission in color scale and gray contours. The first contours and steps are 3σ (σ = 0.6 mJy beam−1). The cyan star marks the IRAS 4A2 dust peak, 3h29m10s.431 (RA) and +31° 13′32.″00 (Dec). The beam is 0.″20 × 0.″ 14 (–26°). Right: dust continuum (grayscale) overlaid with moment 0 contours maps of CH3OH 16(–2,15)–15(–3,13) E (green), integrated over +3 to +10 km s−1, CH3CHO 13(0,13)–12(0,12) E [υt=2] (orange), integrated over +4 to +9 km s−1, and CH2OHCHO 34(5,30)–34(4,31) (blue), integrated over +6 to +8 km s−1. The first contours and steps are 3 and 6σ respectively, with σ = 3.7 mJy beam−1 km s−1 for CH3OH, σ = 2.7 mJy beam−1 km s−1 for CH3CHO, and σ = 2.3 mJy beam−1 km s−1 for CH2OHCHO. The beam is 0.″ 17 × 0.″ 12 (–28°).
Current usage metrics show cumulative count of Article Views (full-text article views including HTML views, PDF and ePub downloads, according to the available data) and Abstracts Views on Vision4Press platform.
Data correspond to usage on the plateform after 2015. The current usage metrics is available 48-96 hours after online publication and is updated daily on week days.
Initial download of the metrics may take a while.