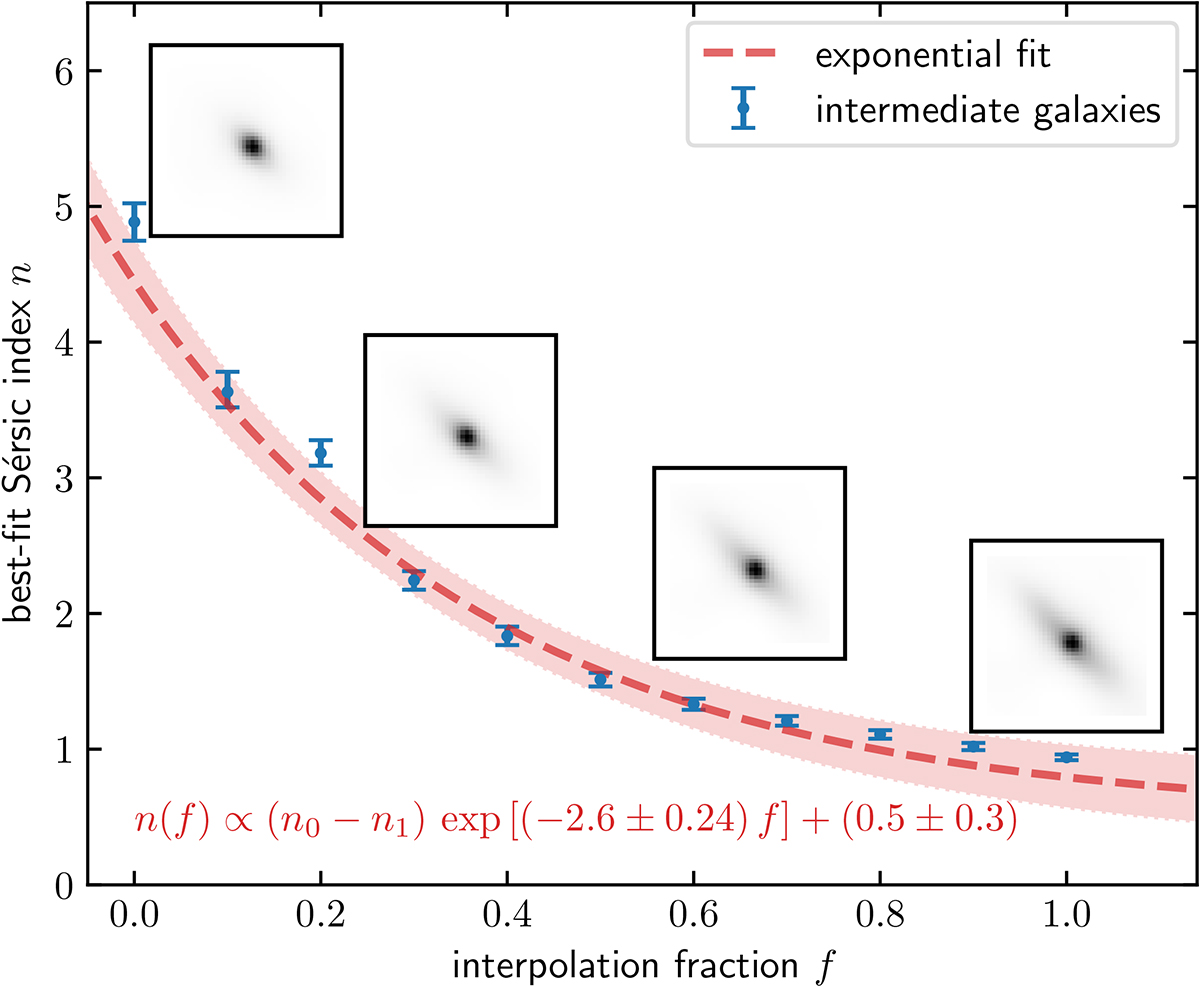
Fig. 8.
Download original image
Dependence of the Sérsic index on the interpolation fraction f. The blue points and error bars are the respective best-fit Sérsic index and the estimated error from pysersic. The red dashed curve shows our best-fit parametric model, with the dotted region designating the 1σ confidence interval. The image insets are inverted stamps at intermediate interpolation points.
Current usage metrics show cumulative count of Article Views (full-text article views including HTML views, PDF and ePub downloads, according to the available data) and Abstracts Views on Vision4Press platform.
Data correspond to usage on the plateform after 2015. The current usage metrics is available 48-96 hours after online publication and is updated daily on week days.
Initial download of the metrics may take a while.