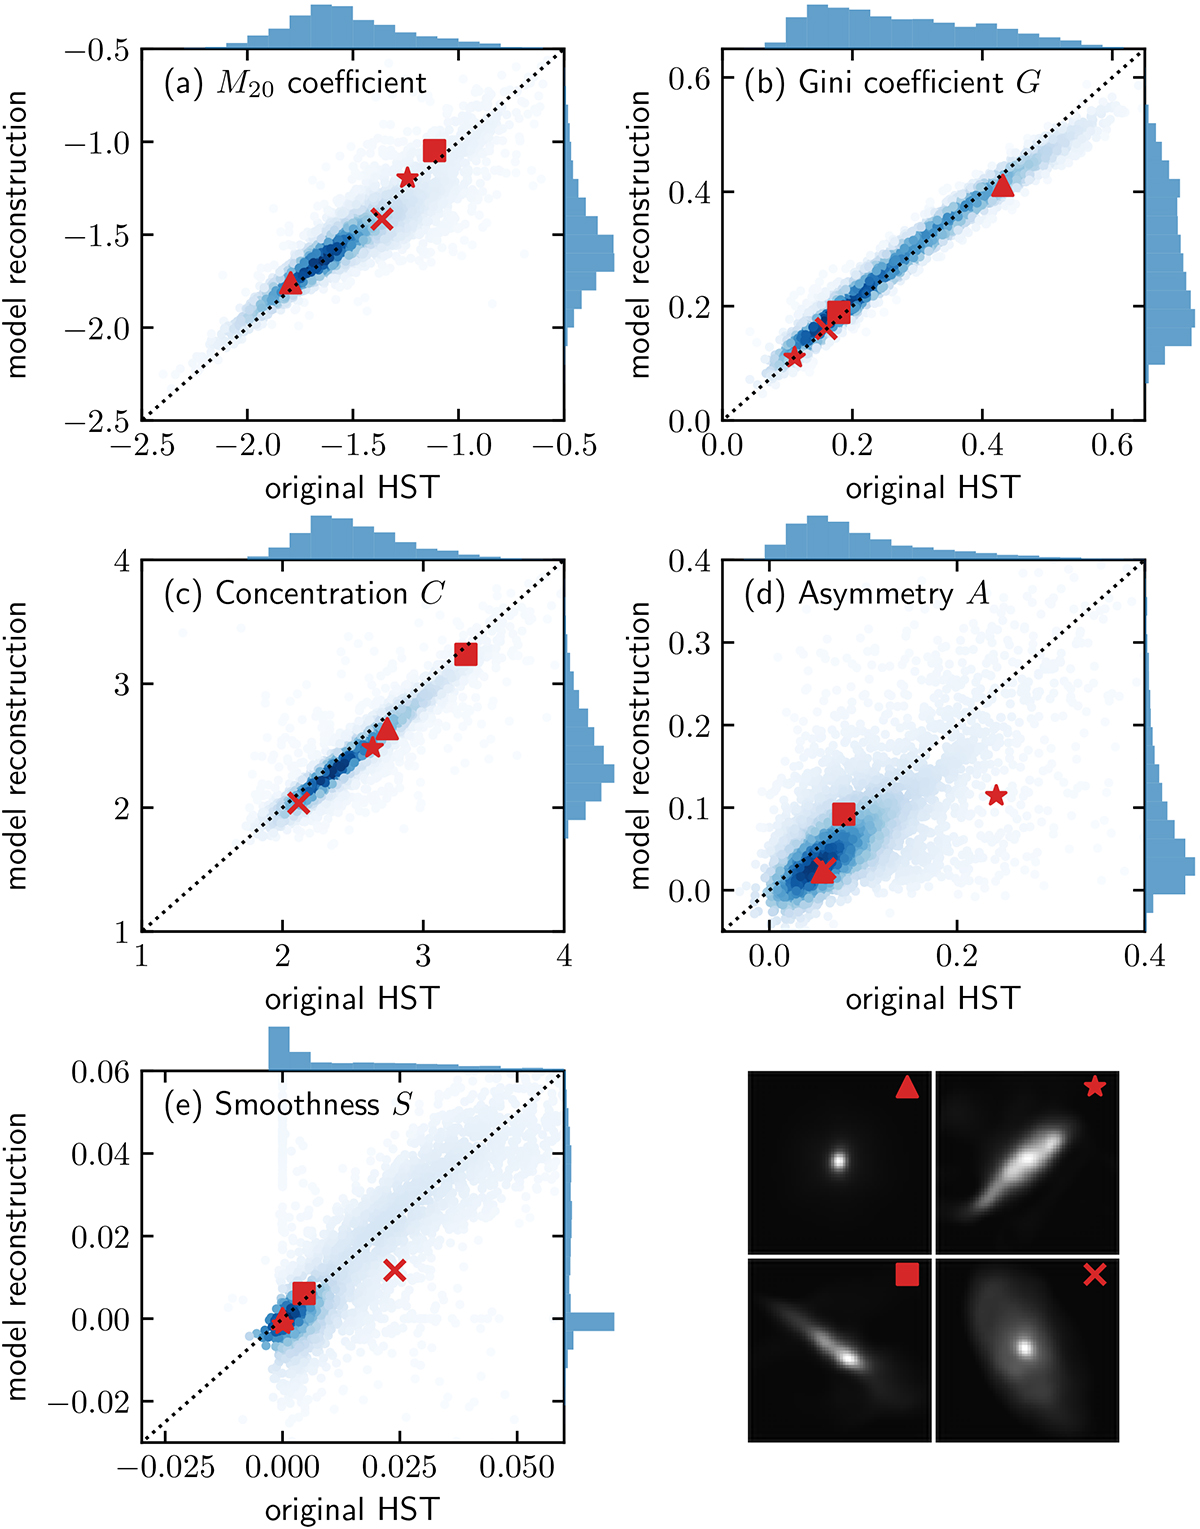
Fig. 4.
Download original image
Comparison of morphological proxies between original HST images (x-axis) and reconstructions by the generative model (y-axis). Panel a shows the M20 index, and panel b shows the Gini coefficient. Panels c–e display the CAS statistics, and panel f depicts four example images from the test data set with their values for the respective parameters shown according to the coloured markers.
Current usage metrics show cumulative count of Article Views (full-text article views including HTML views, PDF and ePub downloads, according to the available data) and Abstracts Views on Vision4Press platform.
Data correspond to usage on the plateform after 2015. The current usage metrics is available 48-96 hours after online publication and is updated daily on week days.
Initial download of the metrics may take a while.