Fig. 2.
Download original image
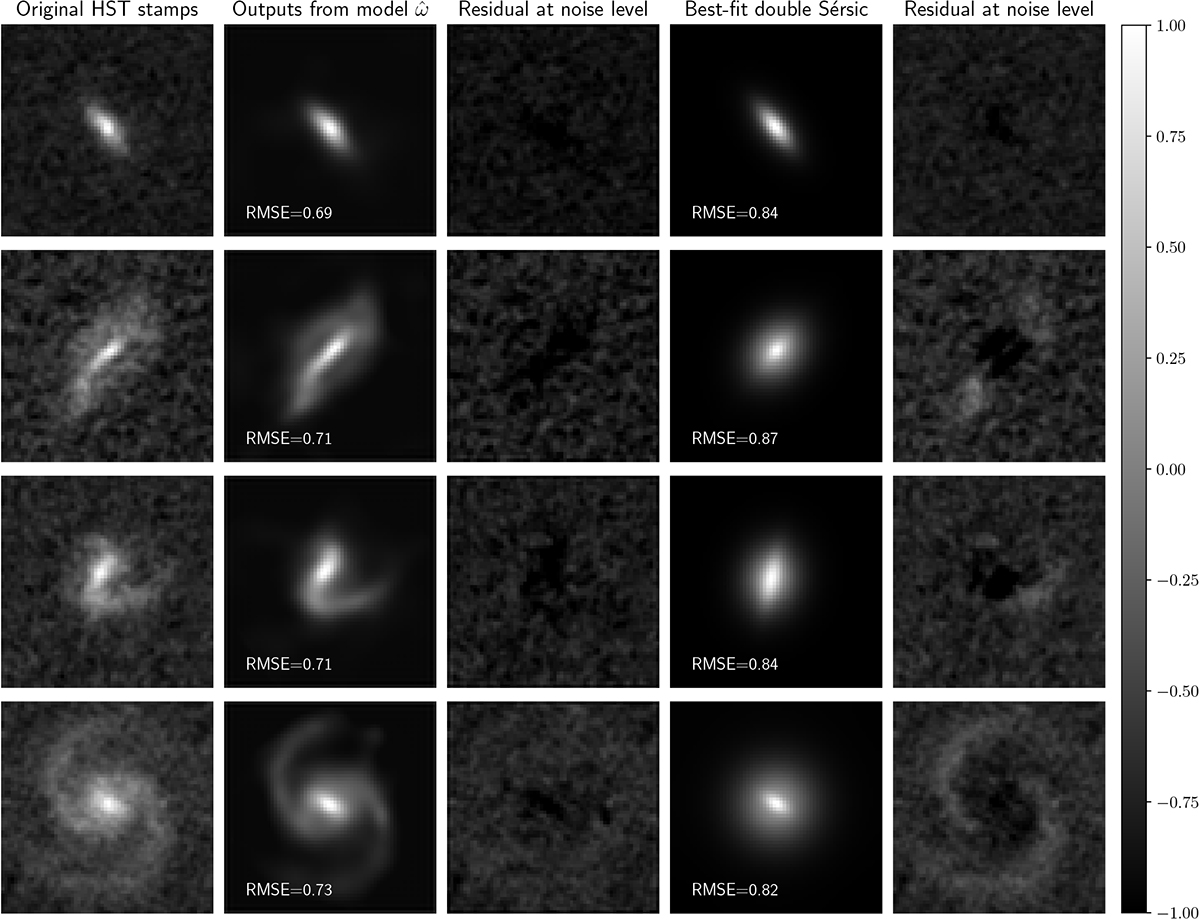
Qualitative check of the HST reconstruction from the generator ![]() . The left column shows original input galaxies, while the second column displays the output of the generator after training. In the middle we plot the residual at noise level between the first two columns, followed by the best-fit double Sérsic from pysersic and the residuals between the original HST stamps and the Sérsic fits. We also display the root mean squared error (RMSE) values between the original image and the reconstruction, for both the parametric and realistic columns.
. The left column shows original input galaxies, while the second column displays the output of the generator after training. In the middle we plot the residual at noise level between the first two columns, followed by the best-fit double Sérsic from pysersic and the residuals between the original HST stamps and the Sérsic fits. We also display the root mean squared error (RMSE) values between the original image and the reconstruction, for both the parametric and realistic columns.
Current usage metrics show cumulative count of Article Views (full-text article views including HTML views, PDF and ePub downloads, according to the available data) and Abstracts Views on Vision4Press platform.
Data correspond to usage on the plateform after 2015. The current usage metrics is available 48-96 hours after online publication and is updated daily on week days.
Initial download of the metrics may take a while.