Open Access
Fig. B.1.
Download original image
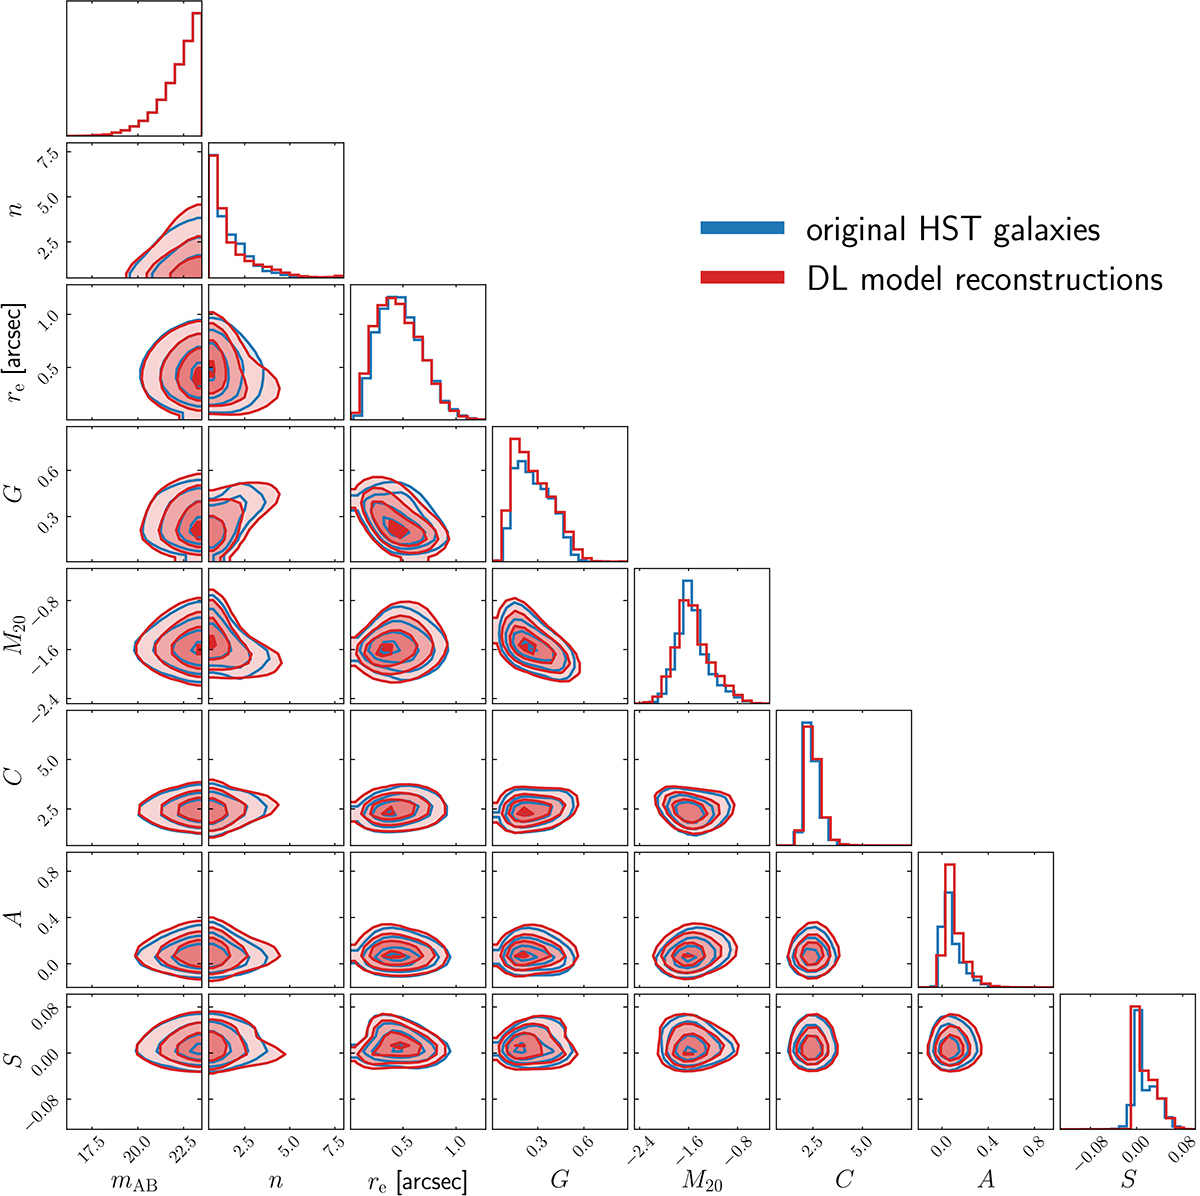
Two-dimensional parameter distributions of magnitude, structural parameters, and morphological proxies. The blue contours show the measurements done directly on the HST images, while the red contours depict the results of measuring on the reconstructed deep learning model outputs.
Current usage metrics show cumulative count of Article Views (full-text article views including HTML views, PDF and ePub downloads, according to the available data) and Abstracts Views on Vision4Press platform.
Data correspond to usage on the plateform after 2015. The current usage metrics is available 48-96 hours after online publication and is updated daily on week days.
Initial download of the metrics may take a while.