Fig. 14.
Download original image
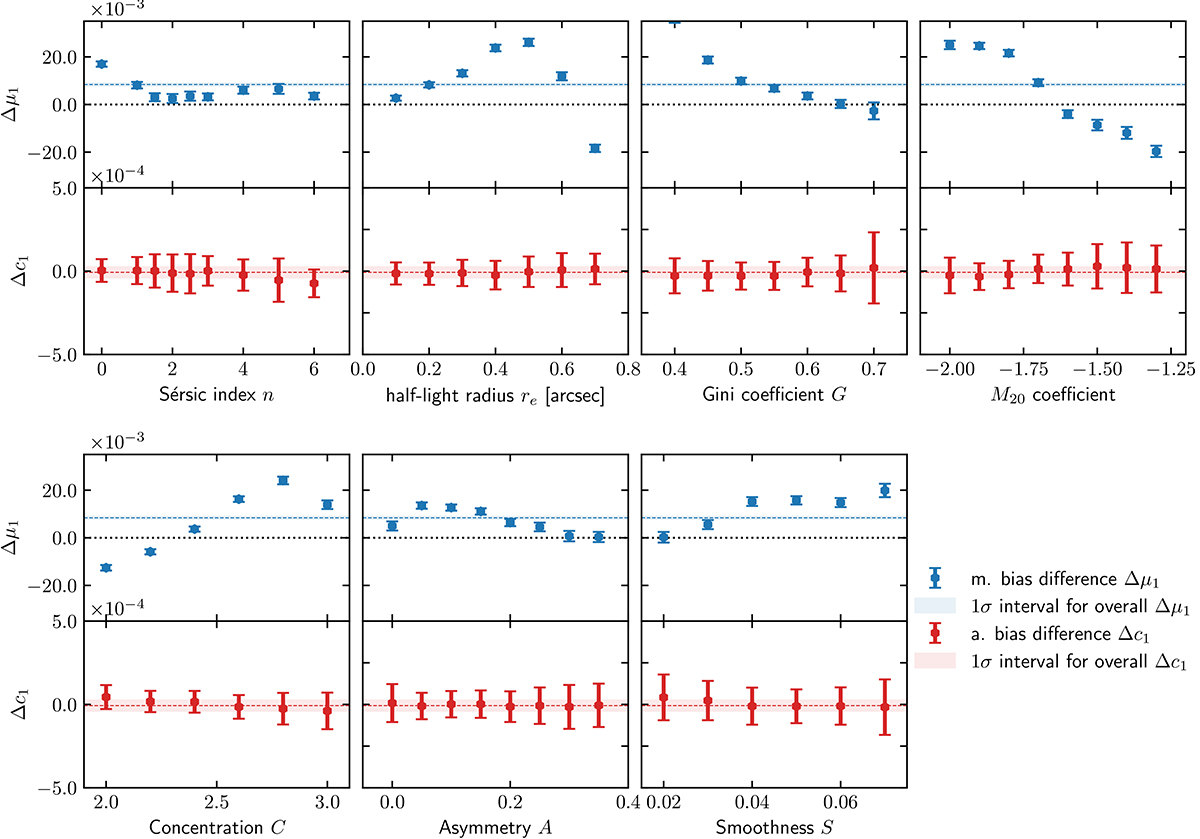
Results of shear bias difference measurements as a function of structural parameters and morphological proxies. The points with error bars depict the multiplicative and additive biases in the respective bin, the dotted lines with the blue or red areas show the means and errors for Δμ1, Δc1 when measuring over the whole sample of 1 × 10⁶ galaxies. The data points are placed at the lower bound of the respective bin, the right-most points include all objects above this threshold.
Current usage metrics show cumulative count of Article Views (full-text article views including HTML views, PDF and ePub downloads, according to the available data) and Abstracts Views on Vision4Press platform.
Data correspond to usage on the plateform after 2015. The current usage metrics is available 48-96 hours after online publication and is updated daily on week days.
Initial download of the metrics may take a while.