Fig. 13.
Download original image
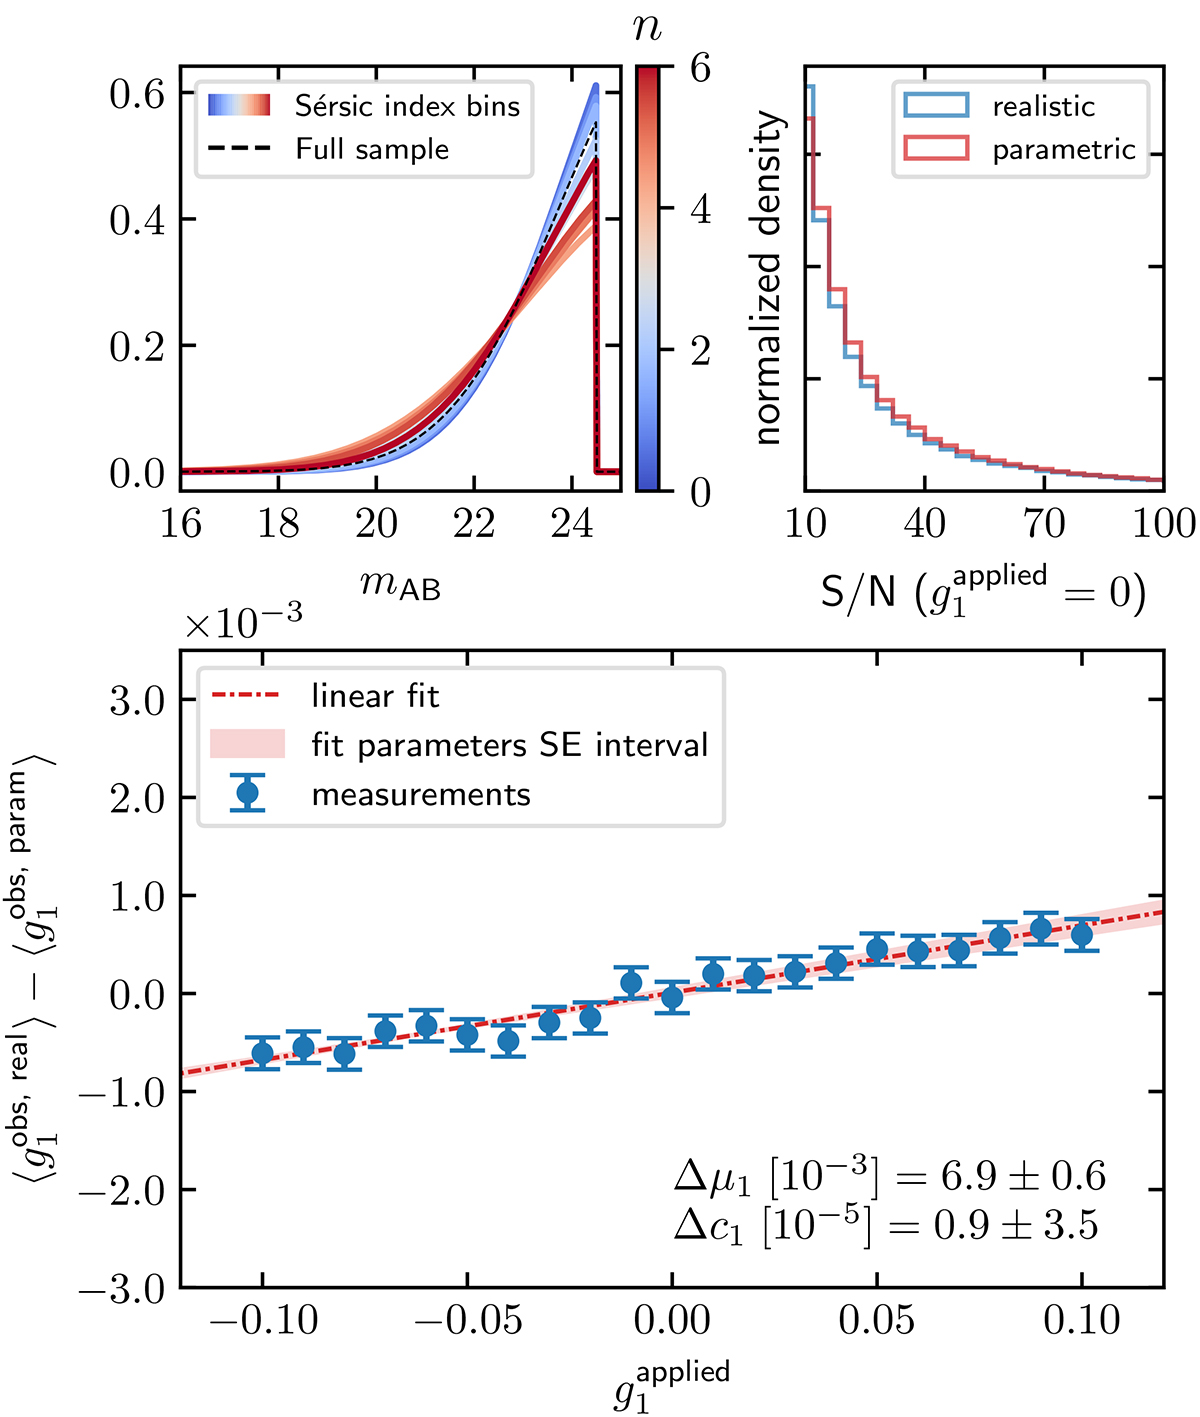
Shear bias difference estimate on a realistic magnitude distribution. The first subplot shows the magnitude distribution modelled with truncated Gaussians over a set of Sérsic index bins and the second subplot shows the measured S/N distribution after the Euclid-like conversion of the generated images. The large panel shows the estimate on the shear bias between the realistic and parametric branches calculated according to Eq. (29).
Current usage metrics show cumulative count of Article Views (full-text article views including HTML views, PDF and ePub downloads, according to the available data) and Abstracts Views on Vision4Press platform.
Data correspond to usage on the plateform after 2015. The current usage metrics is available 48-96 hours after online publication and is updated daily on week days.
Initial download of the metrics may take a while.