Open Access
Fig. 8
Download original image
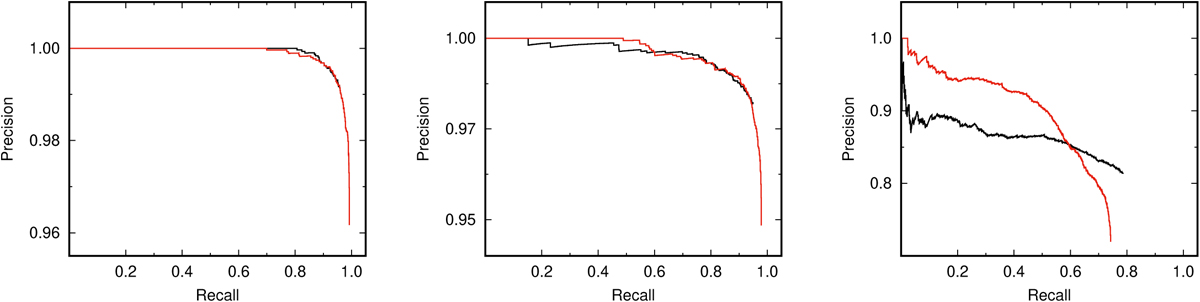
Precision-recall curves of the detection in IoU=0.5 (left), IoU=0.75 (middle), and IoU=0.9 (right) thresholds. The black and red lines correspond to minimum and pulsation patterns, respectively. The calculations were conducted by using the code given by Padilla et al. (2021).
Current usage metrics show cumulative count of Article Views (full-text article views including HTML views, PDF and ePub downloads, according to the available data) and Abstracts Views on Vision4Press platform.
Data correspond to usage on the plateform after 2015. The current usage metrics is available 48-96 hours after online publication and is updated daily on week days.
Initial download of the metrics may take a while.