Fig. 7
Download original image
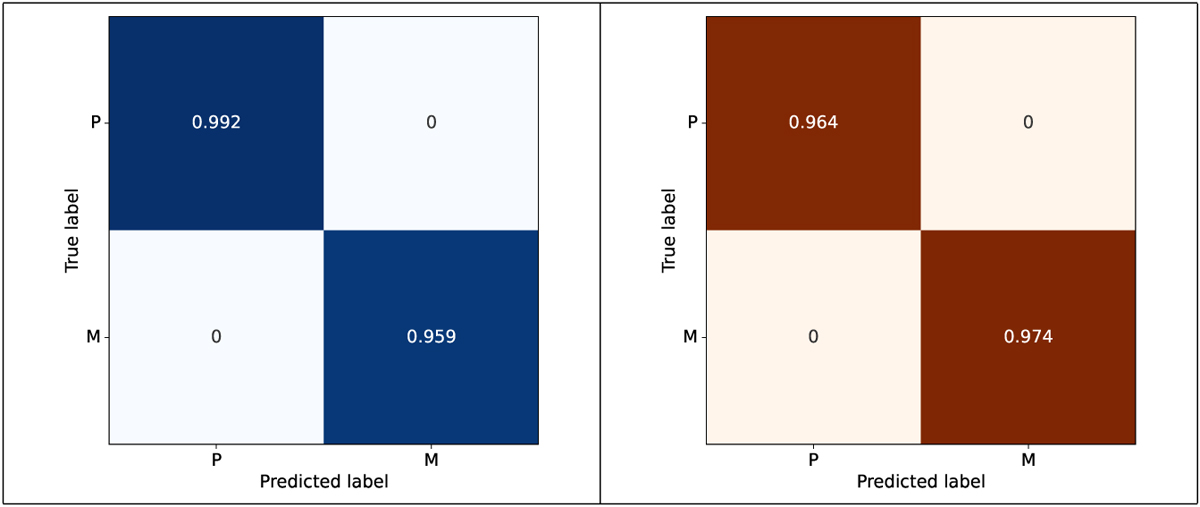
Confusion matrices for the overall (left) and only the observational (right) data in the validation dataset calculated based on the predicted class and bounding boxes by setting the IoU and confidence level to 0.5. We note that 0.08% of pulsation and 0.41% of the minimum patterns were detected as background, namely, predicted as though they are not objects of interest for the overall data, while the percentages are 0.36% and 0.26% for observations. The letters P and M refer to pulsation and minimum patterns, respectively.
Current usage metrics show cumulative count of Article Views (full-text article views including HTML views, PDF and ePub downloads, according to the available data) and Abstracts Views on Vision4Press platform.
Data correspond to usage on the plateform after 2015. The current usage metrics is available 48-96 hours after online publication and is updated daily on week days.
Initial download of the metrics may take a while.