Fig. 6
Download original image
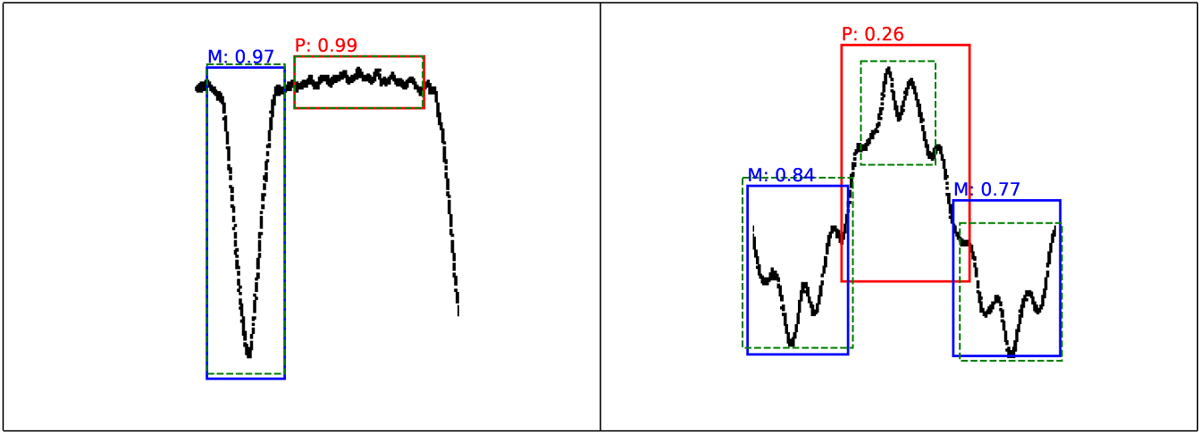
Samples of different detection performances on observational light curve images in the validation set with a predicted bounding box for each ground truth annotation for the SSD model. Detected patterns (in red and blue bounding boxes) with the maximum (left, TIC 73672504) and minimum (right, TIC 232637376) average IoU values are compared to ground truth annotations (green dashed boxes). The numbers above the boxes correspond to the IoU value for the related detection. The letters P and M refer to pulsation and minimum patterns, respectively.
Current usage metrics show cumulative count of Article Views (full-text article views including HTML views, PDF and ePub downloads, according to the available data) and Abstracts Views on Vision4Press platform.
Data correspond to usage on the plateform after 2015. The current usage metrics is available 48-96 hours after online publication and is updated daily on week days.
Initial download of the metrics may take a while.