Fig. 5
Download original image
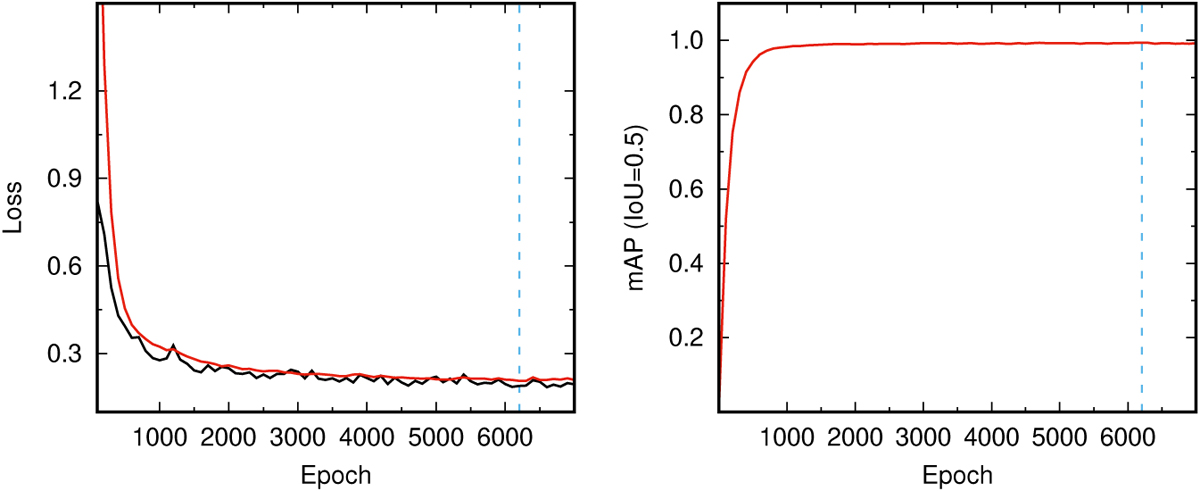
Loss and mAP variation for the SSD model during training and evaluation. The black and red lines refer to training and validation values, respectively. The blue dashed line corresponds to the 6200th epoch, the step for the final model. The plot data was smoothed exponentially by a factor of 0.6 to emphasise the trend. The TensorBoard parameter plots are available in the provided Google Colab notebook8.
Current usage metrics show cumulative count of Article Views (full-text article views including HTML views, PDF and ePub downloads, according to the available data) and Abstracts Views on Vision4Press platform.
Data correspond to usage on the plateform after 2015. The current usage metrics is available 48-96 hours after online publication and is updated daily on week days.
Initial download of the metrics may take a while.