Open Access
Fig. 24
Download original image
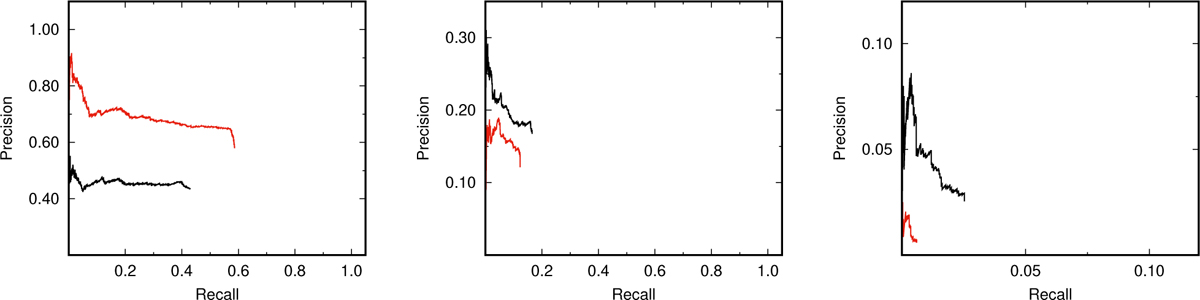
Precision-recall curves for the non-pretrained CNN model plotted with IoU thresholds of 0.5 (left), 0.75 (middle), and 0.9 (right). The black line denotes the minimum, and the red line indicates pulsation patterns. We note that the recall axis is shortened in the rightmost plot for better visibility.
Current usage metrics show cumulative count of Article Views (full-text article views including HTML views, PDF and ePub downloads, according to the available data) and Abstracts Views on Vision4Press platform.
Data correspond to usage on the plateform after 2015. The current usage metrics is available 48-96 hours after online publication and is updated daily on week days.
Initial download of the metrics may take a while.