Fig. 23
Download original image
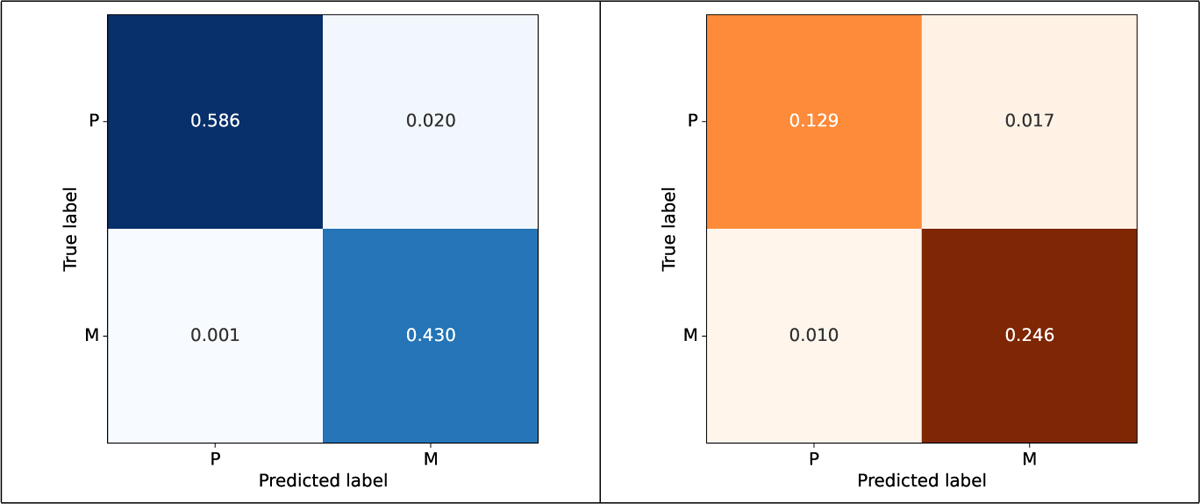
Confusion matrices for the overall data (left) and the observational data (right) in the validation set. The matrices were computed based on predicted classes and bounding boxes, with the IoU and confidence thresholds set to 0.5 and using the non-pretrained CNN-based model. We note that the model is considerably unsuccessful at detecting patterns, especially on observational data. The letters P and M denote pulsation and minimum patterns, respectively.
Current usage metrics show cumulative count of Article Views (full-text article views including HTML views, PDF and ePub downloads, according to the available data) and Abstracts Views on Vision4Press platform.
Data correspond to usage on the plateform after 2015. The current usage metrics is available 48-96 hours after online publication and is updated daily on week days.
Initial download of the metrics may take a while.