Open Access
Fig. 21
Download original image
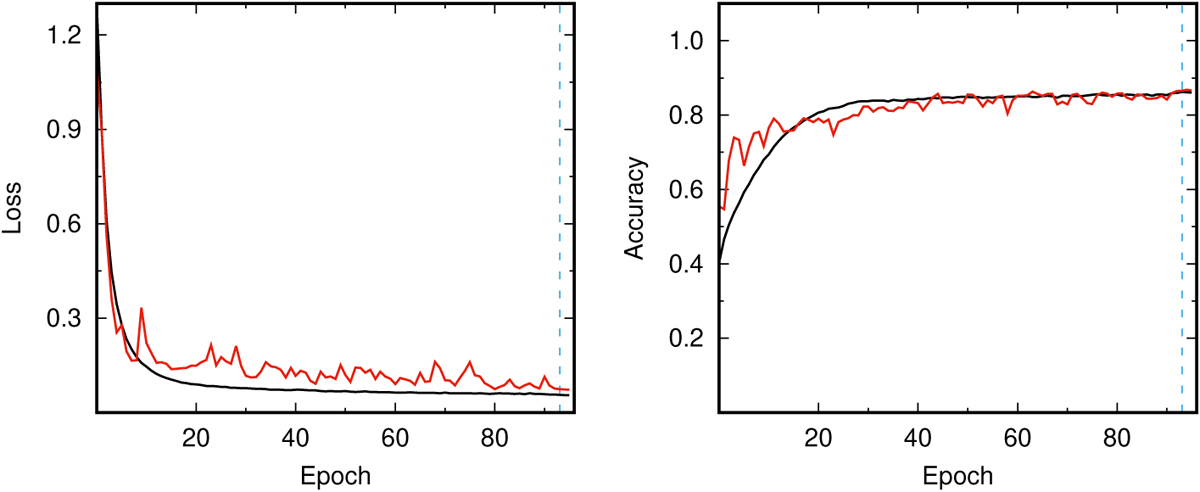
Learning curves for the non-pretrained CNN model. Left: variation of loss over epochs. Right: accuracy of the box predictor as training progresses. The black and red lines represent training and validation values, respectively, with the blue dashed line marking the epoch of the final model.
Current usage metrics show cumulative count of Article Views (full-text article views including HTML views, PDF and ePub downloads, according to the available data) and Abstracts Views on Vision4Press platform.
Data correspond to usage on the plateform after 2015. The current usage metrics is available 48-96 hours after online publication and is updated daily on week days.
Initial download of the metrics may take a while.