Open Access
Fig. 17
Download original image
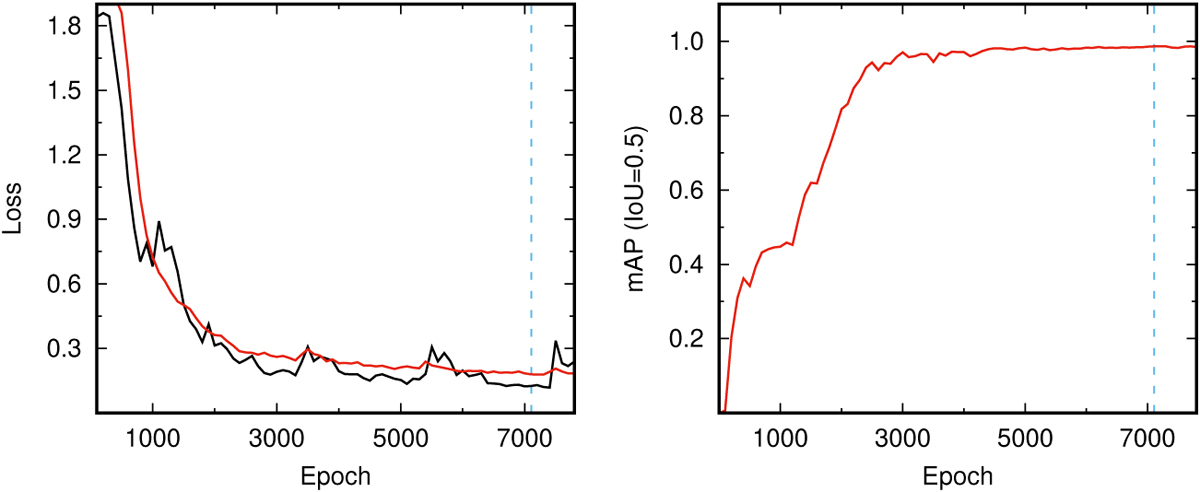
The decrement in Loss and mAP with increasing epochs for the EfficientDet D1 model is illustrated. The black and red lines denote training and validation values, respectively. The blue dashed line marks the final model at the 7100th epoch. TensorBoard parameter plots are available in the provided Google Colab notebook8.
Current usage metrics show cumulative count of Article Views (full-text article views including HTML views, PDF and ePub downloads, according to the available data) and Abstracts Views on Vision4Press platform.
Data correspond to usage on the plateform after 2015. The current usage metrics is available 48-96 hours after online publication and is updated daily on week days.
Initial download of the metrics may take a while.