Fig. 14
Download original image
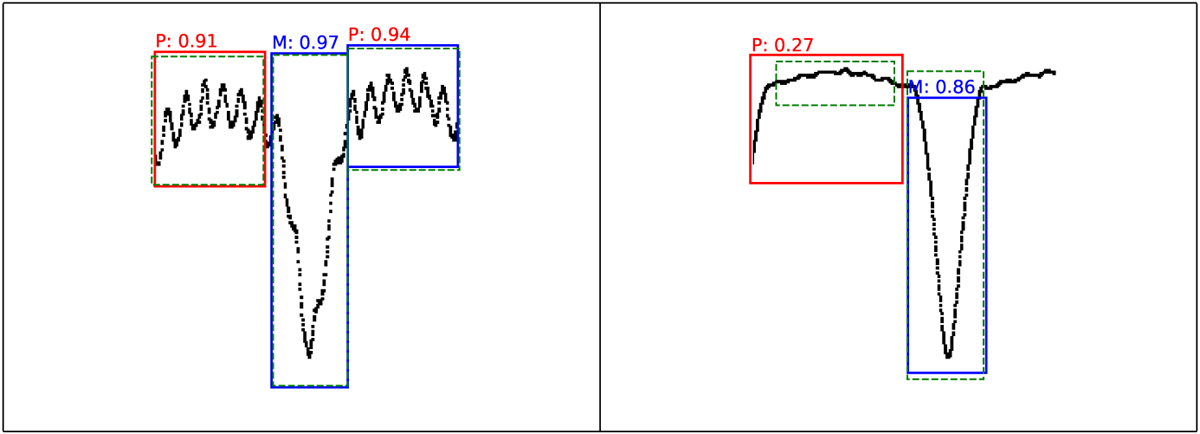
Different detection performances on observational light curve images from the validation set showing predicted bounding boxes for each ground truth annotation using the YOLO model. The detected patterns, enclosed in red and blue boxes, with the highest (TIC 354922610, left) and lowest (TIC 323292655, right) average IoU values are compared to the ground truth annotations marked by green dashed boxes. The numbers above each box indicate the IoU value for that detection. The letters P and M represent pulsation and minimum patterns, respectively.
Current usage metrics show cumulative count of Article Views (full-text article views including HTML views, PDF and ePub downloads, according to the available data) and Abstracts Views on Vision4Press platform.
Data correspond to usage on the plateform after 2015. The current usage metrics is available 48-96 hours after online publication and is updated daily on week days.
Initial download of the metrics may take a while.