Fig. 10
Download original image
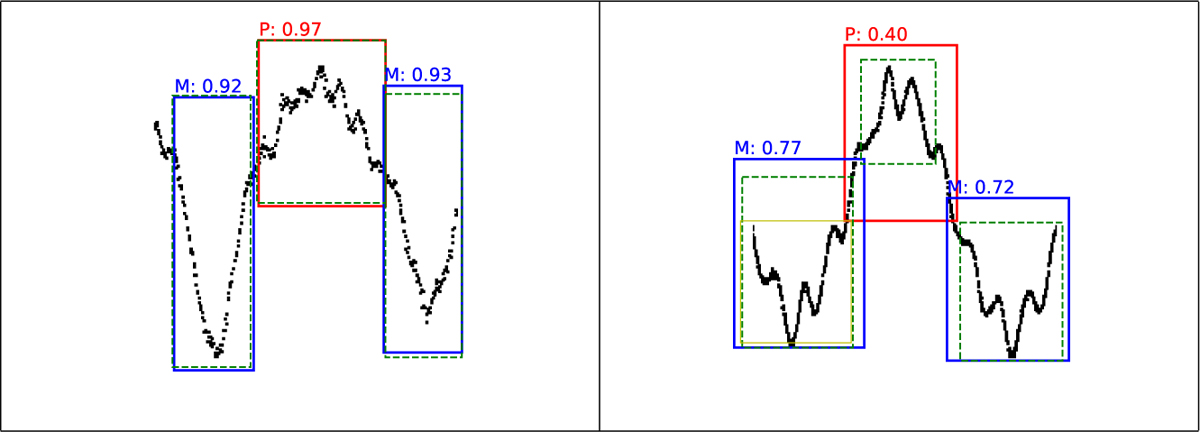
Examples of varying detection performance of the Faster R-CNN model on observational light curve images from the validation set displaying predicted bounding boxes for each ground truth annotation. The detected patterns (in red and blue bounding boxes) with the highest (left, TIC 158794976) and lowest (right, TIC 232637376) average IoU values are compared against ground truth annotations (green dashed boxes). The numbers above each box indicate the IoU value for the corresponding detection. The letters P and M denote pulsation and minimum patterns, respectively. The yellow box on the right panel represents the additional detection that is not present in the ground truth annotations.
Current usage metrics show cumulative count of Article Views (full-text article views including HTML views, PDF and ePub downloads, according to the available data) and Abstracts Views on Vision4Press platform.
Data correspond to usage on the plateform after 2015. The current usage metrics is available 48-96 hours after online publication and is updated daily on week days.
Initial download of the metrics may take a while.