Fig. 1
Download original image
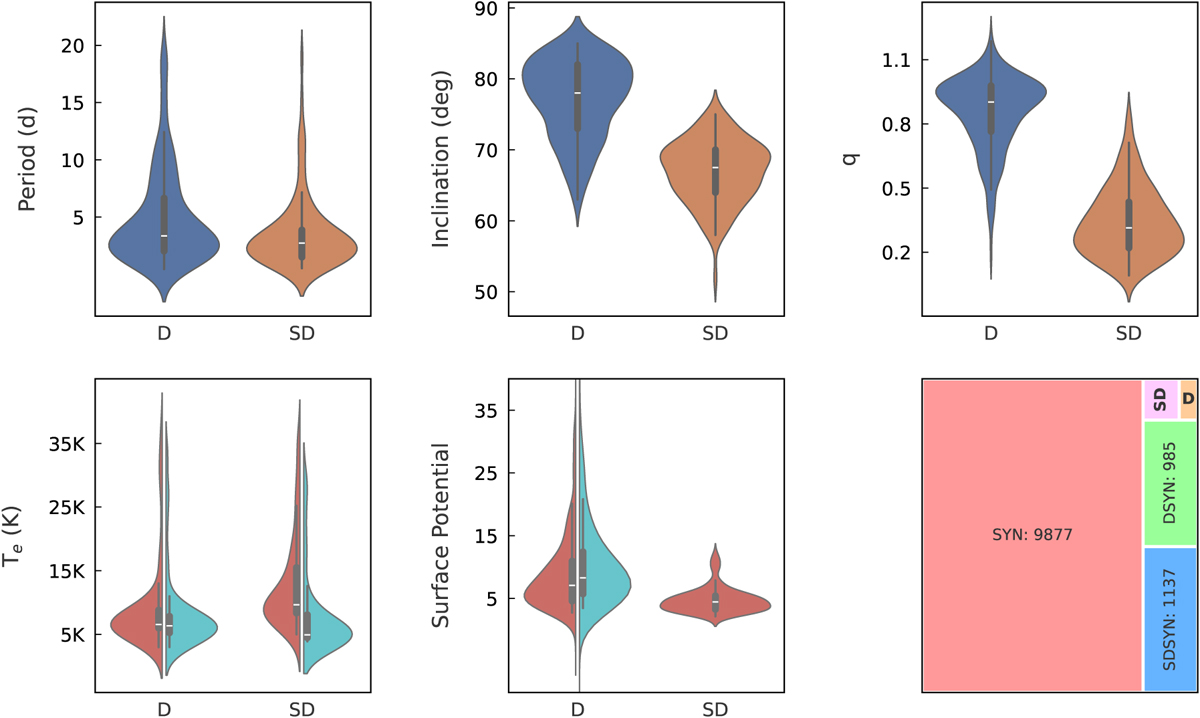
Violin plot showing the distribution of the parameters used in synthetic construction of light curves for detached (D) and semidetached (SD) binaries. The white lines at the centres are the median values covered by black boxes whose lower and upper boundaries are the first and third quartiles, Q1 and Q3 (Krzywinski & Altman 2014). The two ends of the lines overlap with the boxes, denoting the minimum and maximum values of the parameter. The density plots around the boxes represent the probabilities of the corresponding values in the y-axis, where the wider one refers to more frequent occurrences. The effective temperature (Te) and surface potential distributions for the primary (red, left) and secondary (green, right) components are shown in split areas for the sake of a smooth comparison of the values in the two leftmost plots in the bottom pane. We note that the surface potential plot for the semidetached systems only contains values of components well detached from their Roche lobe since the potential of the other component is assumed to be equal to its critical value, indicating that the component fills its Roche lobe. The last box is a treemap plotted based on the number of light curves in different phases of light curve construction. The numbers of detached and semidetached systems from catalogues are 110 and 212 (two small tiles in the upper right). DSYN and SDSYN are synthetic detached and semidetached light curves constructed using the catalogue data, while SYN refers to the total number of synthetic light curves mimicking EBPCs and used in model training and validation.
Current usage metrics show cumulative count of Article Views (full-text article views including HTML views, PDF and ePub downloads, according to the available data) and Abstracts Views on Vision4Press platform.
Data correspond to usage on the plateform after 2015. The current usage metrics is available 48-96 hours after online publication and is updated daily on week days.
Initial download of the metrics may take a while.