Fig. 9.
Download original image
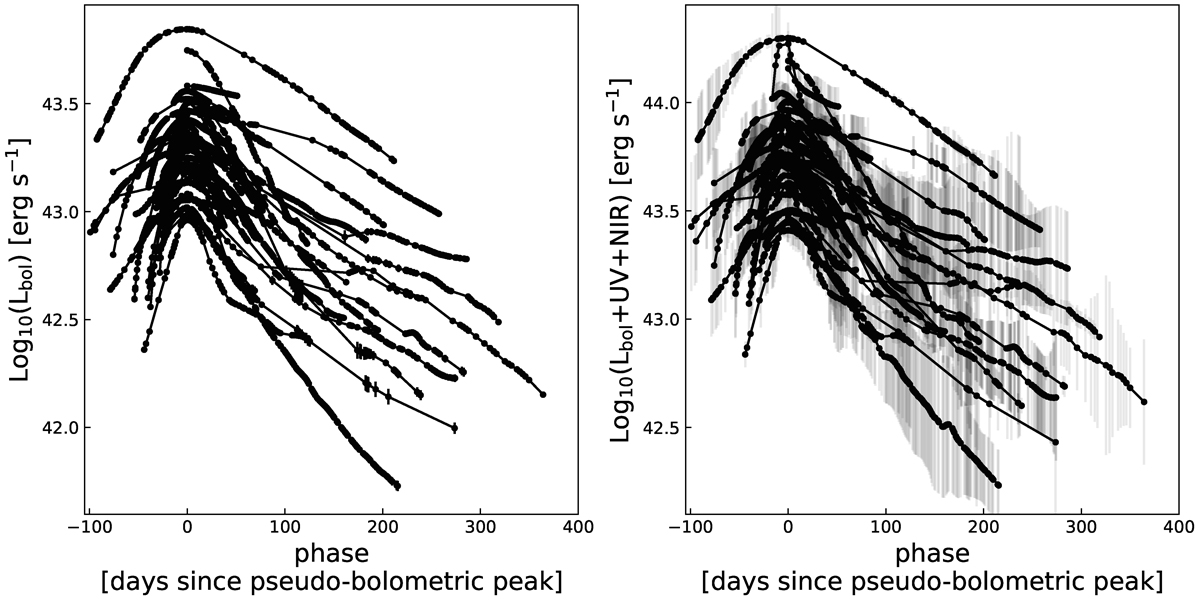
Pseudo-bolometric light curves of the SLSN II sample. The left panel shows the results of integrating the observed SED considering the epochs for which we have all three gri photometric observations. The right panel shows the results of adding extrapolations to both the UV and NIR to the SED obtained from the gri photometric observations.
Current usage metrics show cumulative count of Article Views (full-text article views including HTML views, PDF and ePub downloads, according to the available data) and Abstracts Views on Vision4Press platform.
Data correspond to usage on the plateform after 2015. The current usage metrics is available 48-96 hours after online publication and is updated daily on week days.
Initial download of the metrics may take a while.