Fig. 7.
Download original image
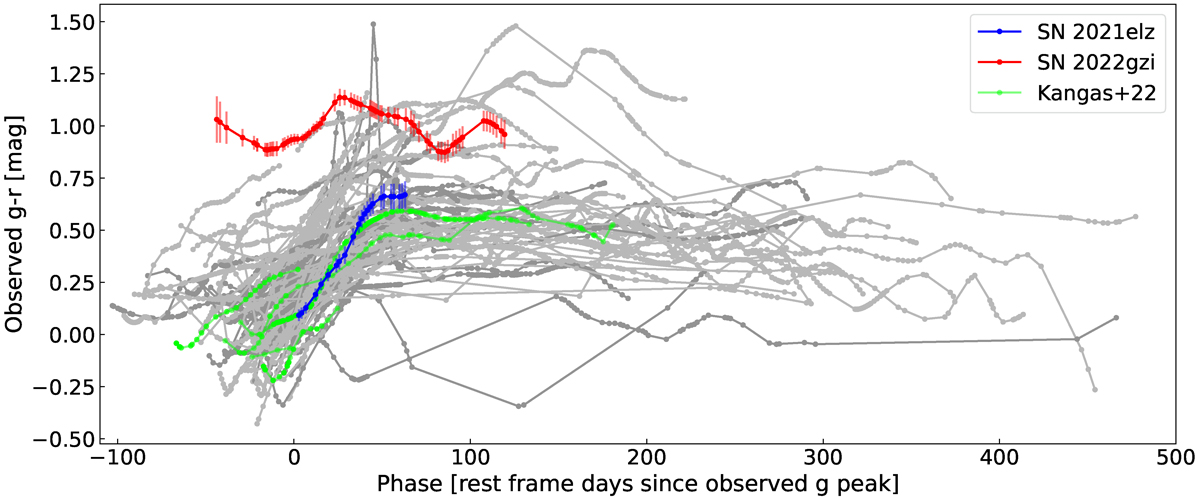
Observed g − r colors with respect to rest frame days since g band peak. In dark gray, we show events at z < 0.17 and in light gray events at z ≥ 0.17. In red we highlight the event with the faintest rest frame peak absolute magnitude in g band. SN 2022gzi is the reddest event at peak, indicating that it may be suffering from considerable host extinction. In blue we highlight the event with the brightest rest frame peak absolute magnitude in g band, the color evolution of this SLSN II is consistent with the general trend of the sample. In lime we show the observed g − r colors of the events with z ≤ 0.17 in the ZTF SLSN II sample presented by Kangas et al. (2022), see Sect. 5.1 for a discussion.
Current usage metrics show cumulative count of Article Views (full-text article views including HTML views, PDF and ePub downloads, according to the available data) and Abstracts Views on Vision4Press platform.
Data correspond to usage on the plateform after 2015. The current usage metrics is available 48-96 hours after online publication and is updated daily on week days.
Initial download of the metrics may take a while.