Fig. 5.
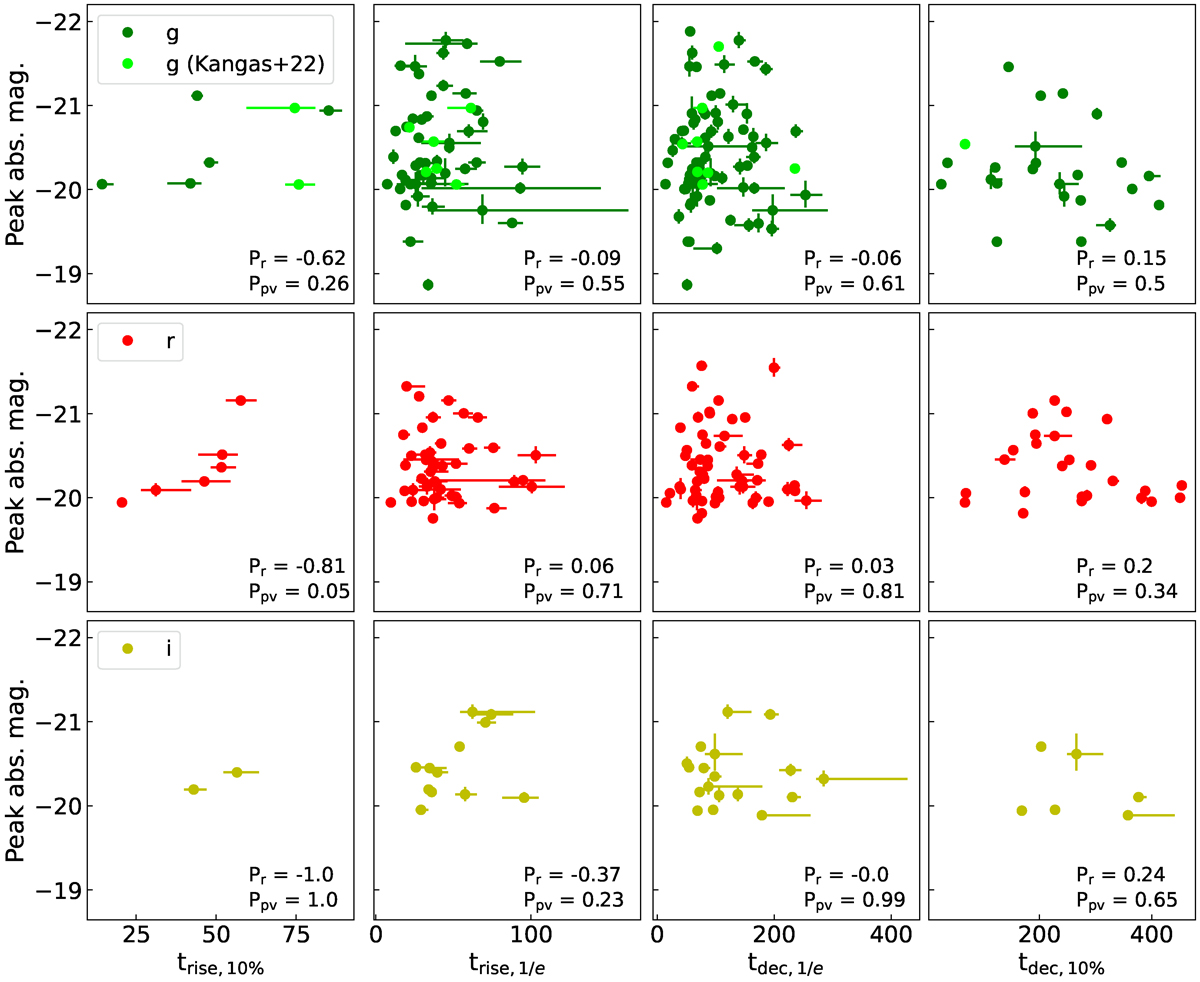
Download original image
Timescales versus peak absolute magnitudes. From top to bottom: gri band (respectively) rest frame peak absolute magnitude compared to trise, 10% (first columns), trise, 1/e (second columns), tdec, 1/e (third column) and tdec, 10% (last column). The corresponding Pearson’s r parameter (Pr) and associated p value (Ppv) for each distribution is annotated in the bottom right of the corresponding panels, no significant correlation is found for these parameters. Lime dots in the first row show the corresponding parameter distribution of the ZTF SLSN II sample presented by Kangas et al. (2022), see Sect. 5.1 for a discussion. These additional events are not included in the correlation analysis.
Current usage metrics show cumulative count of Article Views (full-text article views including HTML views, PDF and ePub downloads, according to the available data) and Abstracts Views on Vision4Press platform.
Data correspond to usage on the plateform after 2015. The current usage metrics is available 48-96 hours after online publication and is updated daily on week days.
Initial download of the metrics may take a while.